

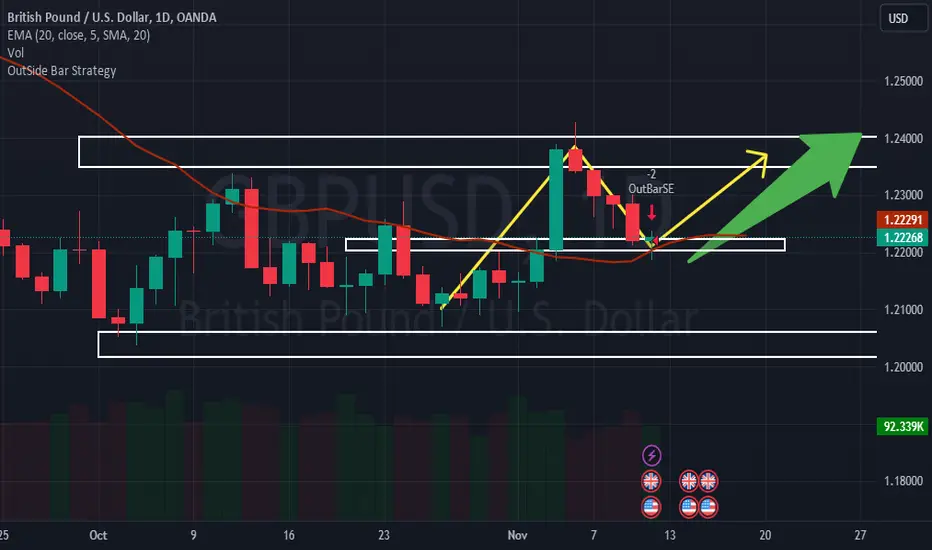
GBP/USD extends its slide below the 1.2200 level in early US trading. UK GDP data reveals a better-than-expected 0.6% year-on-year growth in the third quarter. However, these figures fail to propel the currency pair as investors await next week's key data for clearer direction. The ascending trendline, the Fibonacci retracement level of the latest downtrend, the 100-period Simple Moving Average (SMA) on the 4-hour chart, and the 200-period SMA collectively form a robust support level at 1.2200. If GBP/USD drops below this level and confirms it as resistance, the next downside targets could be set at 1,2140 (static level) and 1,2100 (static level).
On the upside, 1,2250 (SMA 50) is considered a dynamic resistance level ahead of 1,2275 (SMA 20) and 1,2300 (38.2% Fibonacci retracement level).
On the upside, 1,2250 (SMA 50) is considered a dynamic resistance level ahead of 1,2275 (SMA 20) and 1,2300 (38.2% Fibonacci retracement level).

相关出版物
免责声明
这些信息和出版物并非旨在提供,也不构成TradingView提供或认可的任何形式的财务、投资、交易或其他类型的建议或推荐。请阅读使用条款了解更多信息。