

There are so many interesting things going on here from a technical analysis perspective. Let's break them down per section.
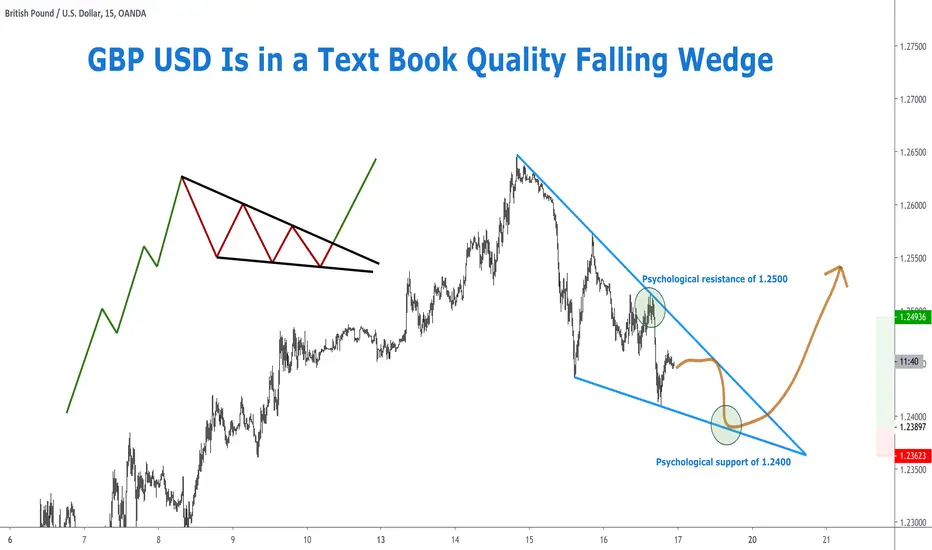
First of all, we cannot miss this beautiful falling wedge. A falling wedge is formed when price consolidates between downward sloping support and resistance lines. The slope of the resistance line has to be steeper than that of the resistance. This indicates that lower highs are being formed faster than lower lows. This is a bullish pattern, where we expect a high impact positive rally if the price breaks through the bottom support. The price has beautifully stayed within the boundaries so far, validating the falling wedge pattern.
The most interesting thing is that the way it's forming is exactly like the text books draw the pattern. If you ever wanted to understand a falling wedge, this is the most classic way of getting one! I drew the textbook example on the chart for your reference.
The second part that draws my attention is the beautiful levels of which the price found resistance recently at exactly 1.2500. This is not only a price based resistance level, but also a psychological resistance level. Then, if we combine that with the trajectory of this wedge, we will see another such level soon at 1.24 near the bottom support line of the wedge. It is around this area that we can set our long position for beautiful profits.
Follow me for consistent high quality updates, with clear explanations and charts.
Please like this post to support me.
- Trading Guru
--------------------------------------------------------------
Disclaimer!
This post does not provide financial advice. It is for educational purposes only!
First of all, we cannot miss this beautiful falling wedge. A falling wedge is formed when price consolidates between downward sloping support and resistance lines. The slope of the resistance line has to be steeper than that of the resistance. This indicates that lower highs are being formed faster than lower lows. This is a bullish pattern, where we expect a high impact positive rally if the price breaks through the bottom support. The price has beautifully stayed within the boundaries so far, validating the falling wedge pattern.
The most interesting thing is that the way it's forming is exactly like the text books draw the pattern. If you ever wanted to understand a falling wedge, this is the most classic way of getting one! I drew the textbook example on the chart for your reference.
The second part that draws my attention is the beautiful levels of which the price found resistance recently at exactly 1.2500. This is not only a price based resistance level, but also a psychological resistance level. Then, if we combine that with the trajectory of this wedge, we will see another such level soon at 1.24 near the bottom support line of the wedge. It is around this area that we can set our long position for beautiful profits.
Follow me for consistent high quality updates, with clear explanations and charts.
Please like this post to support me.
- Trading Guru
--------------------------------------------------------------
Disclaimer!
This post does not provide financial advice. It is for educational purposes only!

Free crypto scanner on Telegram (35k members):
t.me/CryptoScanner100eyes
t.me/CryptoScanner100eyes
免责声明
这些信息和出版物并非旨在提供,也不构成TradingView提供或认可的任何形式的财务、投资、交易或其他类型的建议或推荐。请阅读使用条款了解更多信息。
Free crypto scanner on Telegram (35k members):
t.me/CryptoScanner100eyes
t.me/CryptoScanner100eyes
免责声明
这些信息和出版物并非旨在提供,也不构成TradingView提供或认可的任何形式的财务、投资、交易或其他类型的建议或推荐。请阅读使用条款了解更多信息。