

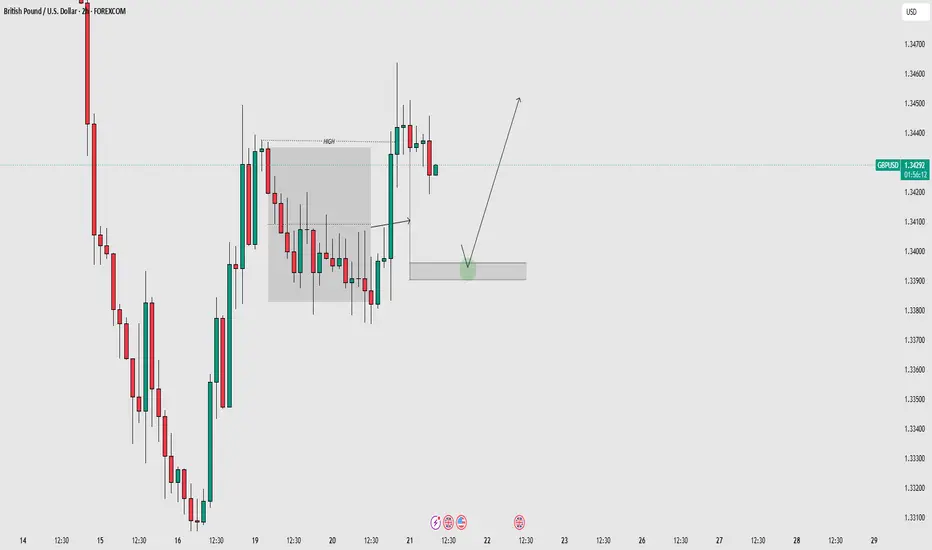
The lower timeframes were showing too many fake candles and unclear movements, so I shifted to the 2H timeframe to get a cleaner view of the supply and demand structure. After moving to the higher timeframe, the market structure became much clearer and easier to analyze.
Based on the 2H structure, the market successfully broke the previous high. After the breakout, I identified the nearest supply area and projected it forward from the bearish candle zone. This helped me create a clean reversal zone.
Now the main focus is simple — if the market forms any strong positive candle or bullish confirmation inside this reversal zone, then price could continue moving toward the upside.
At the moment, the structure looks much cleaner compared to the lower timeframes, and the reaction inside the reversal zone will decide the next move.
This analysis is based on the MMC concepts designed by Candle King. A huge amount of credit goes to him — his concepts have helped me understand and solve market structure much more clearly.
Based on the 2H structure, the market successfully broke the previous high. After the breakout, I identified the nearest supply area and projected it forward from the bearish candle zone. This helped me create a clean reversal zone.
Now the main focus is simple — if the market forms any strong positive candle or bullish confirmation inside this reversal zone, then price could continue moving toward the upside.
At the moment, the structure looks much cleaner compared to the lower timeframes, and the reaction inside the reversal zone will decide the next move.
This analysis is based on the MMC concepts designed by Candle King. A huge amount of credit goes to him — his concepts have helped me understand and solve market structure much more clearly.

免责声明
这些信息和出版物并非旨在提供,也不构成TradingView提供或认可的任何形式的财务、投资、交易或其他类型的建议或推荐。请阅读使用条款了解更多信息。
免责声明
这些信息和出版物并非旨在提供,也不构成TradingView提供或认可的任何形式的财务、投资、交易或其他类型的建议或推荐。请阅读使用条款了解更多信息。