

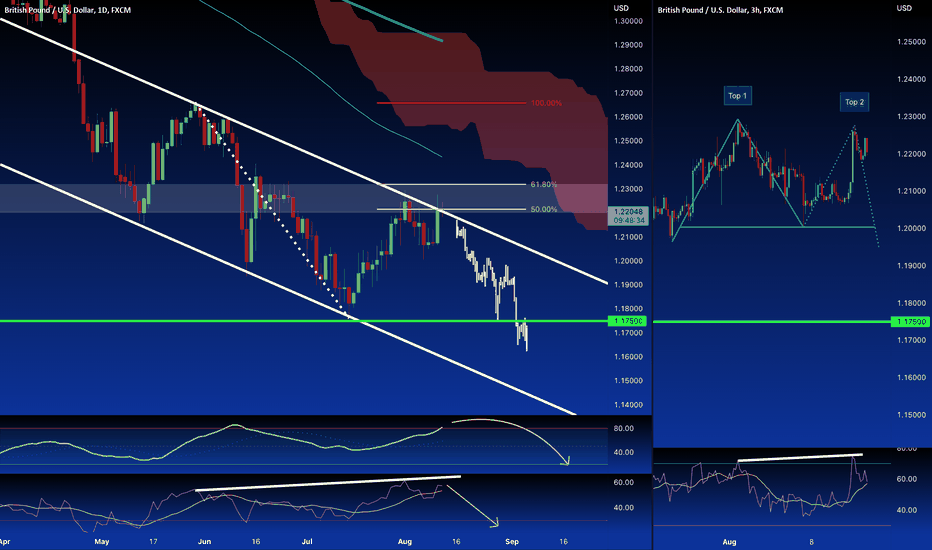
As explained yesterday
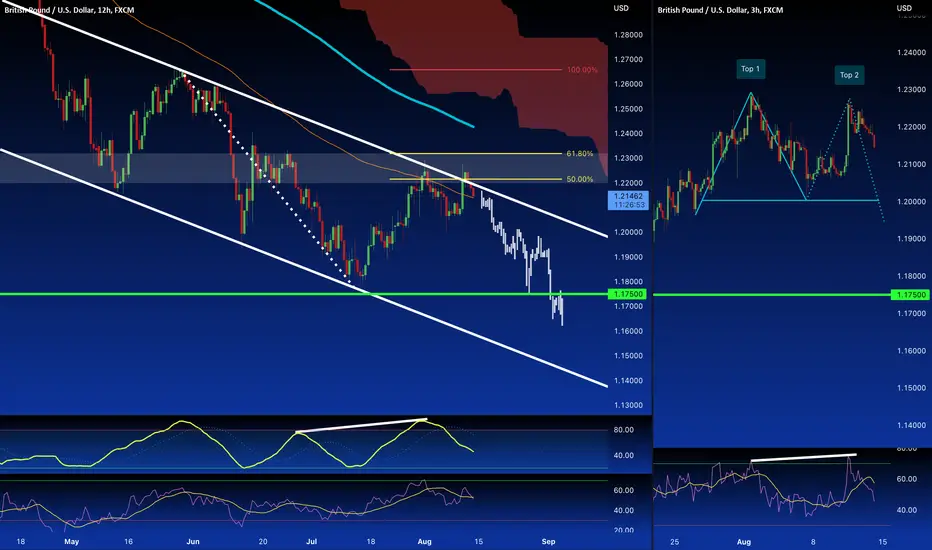
the price after the CPI release news had in a first moment Big Bullish candle, absorbed and then the retested again the Dynamic resistance given from the Bearish channel inside the 50 / 61.8% Fibo levels and Resistance area ( White rectangle ) before definitely dropdown. The Stochastic it's a comeback in the range area after the Overbought area, ( note the Divergence ) meanwhile, the RSI Turned Bearish today in the H12 timeframe.
In the lower timeframe, on the Right of the chart, we can see a Double Top formation with divergence and Overbought by the RSI.
Yesterday we show this opportunity and today the price dropped down following our Idea of the forecast.
the price after the CPI release news had in a first moment Big Bullish candle, absorbed and then the retested again the Dynamic resistance given from the Bearish channel inside the 50 / 61.8% Fibo levels and Resistance area ( White rectangle ) before definitely dropdown. The Stochastic it's a comeback in the range area after the Overbought area, ( note the Divergence ) meanwhile, the RSI Turned Bearish today in the H12 timeframe.
In the lower timeframe, on the Right of the chart, we can see a Double Top formation with divergence and Overbought by the RSI.
Yesterday we show this opportunity and today the price dropped down following our Idea of the forecast.

相关出版物
免责声明
这些信息和出版物并非旨在提供,也不构成TradingView提供或认可的任何形式的财务、投资、交易或其他类型的建议或推荐。请阅读使用条款了解更多信息。