

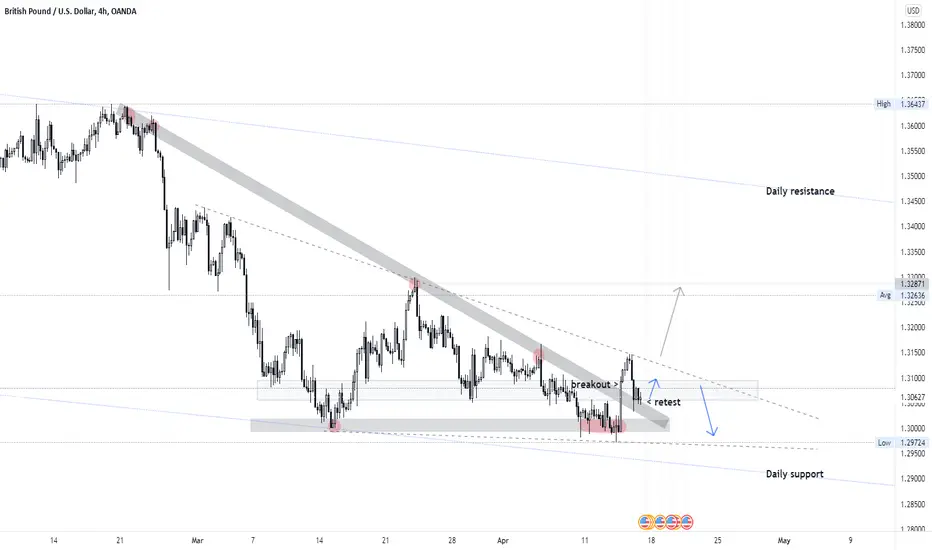
This is the technical analysis of GBPUSD H4. Based on chart pattern analysis. We can find a triangle and wedge pattern,
The direction of the trend is sideways tends to be bearish, there are economic data to be released, prices will fluctuate. we can take this opportunity to take a buy low - sell high :
1. The price is still moving in the pattern area.
2. Moderate buy action is possible, the price has retesting triangle area.
Risk : The UK economy does not seem to be in good shape relative to the U.S. with consumer confidence on the decline, rampant inflation and the end of free COVID-19 testing could add to negative data prints to come. A weaker than expected figure could add to bearish bets on the cable pairing.
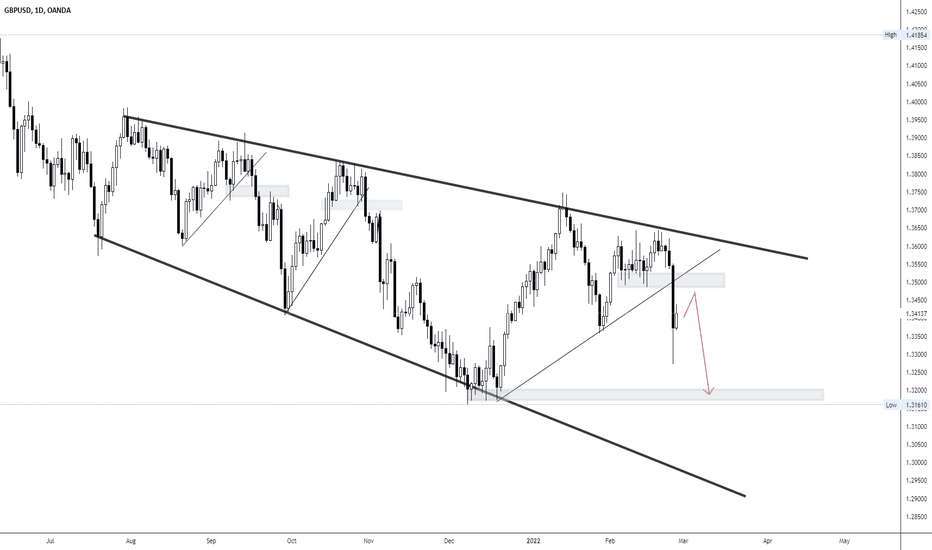
The direction of the trend is sideways tends to be bearish, there are economic data to be released, prices will fluctuate. we can take this opportunity to take a buy low - sell high :
1. The price is still moving in the pattern area.
2. Moderate buy action is possible, the price has retesting triangle area.
Risk : The UK economy does not seem to be in good shape relative to the U.S. with consumer confidence on the decline, rampant inflation and the end of free COVID-19 testing could add to negative data prints to come. A weaker than expected figure could add to bearish bets on the cable pairing.

免责声明
这些信息和出版物并非旨在提供,也不构成TradingView提供或认可的任何形式的财务、投资、交易或其他类型的建议或推荐。请阅读使用条款了解更多信息。