
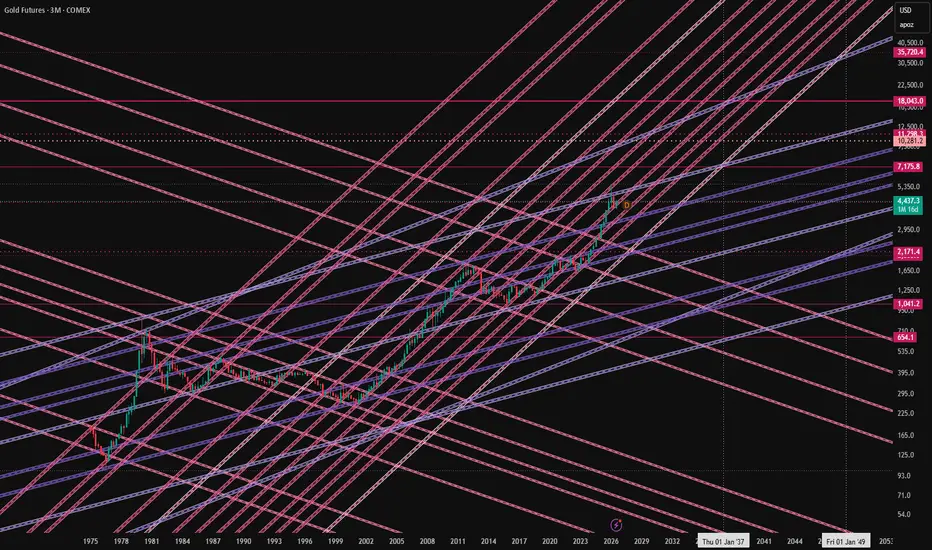
Hi!, trying to look into the future (2050) , not so easy but if chart shows the physics, very much possible , plotted levels needs the consideration.
u can see the preferred angles here followed by the gold future for rising and for correction , gold followed the sharper rising angle for last many years.
lets c , will post the chart in lower time frame in below slides
u can see the preferred angles here followed by the gold future for rising and for correction , gold followed the sharper rising angle for last many years.
lets c , will post the chart in lower time frame in below slides
注释
in weekly time frame , got a resistance 注释
zoom in quarterly time frame showing the resistance and sup 注释
zoom in half yearly time frame 注释
in day tf , with added parallels 注释
weekly 注释
easy for eyes 注释
zoom in 注释
注释
day tf 注释
4H 注释
43 mins for new 8H, 注释
nothing is random price is playing the angles, in 1H 注释
price is above the monthly res a strong one so still a reference for us, next one is around 5112, in between we have some weekly and other levels also the angles /tl previous day able to reach the day level 注释
main chart , weekly avoiding the the hammer and inverted hammer range but within the inside bar range , lets c 注释
got the sup of 6M inverted hammer so a testing range for us , some important 12M levels for reference 注释
weekly 
免责声明
这些信息和出版物并非旨在提供,也不构成TradingView提供或认可的任何形式的财务、投资、交易或其他类型的建议或推荐。请阅读使用条款了解更多信息。