
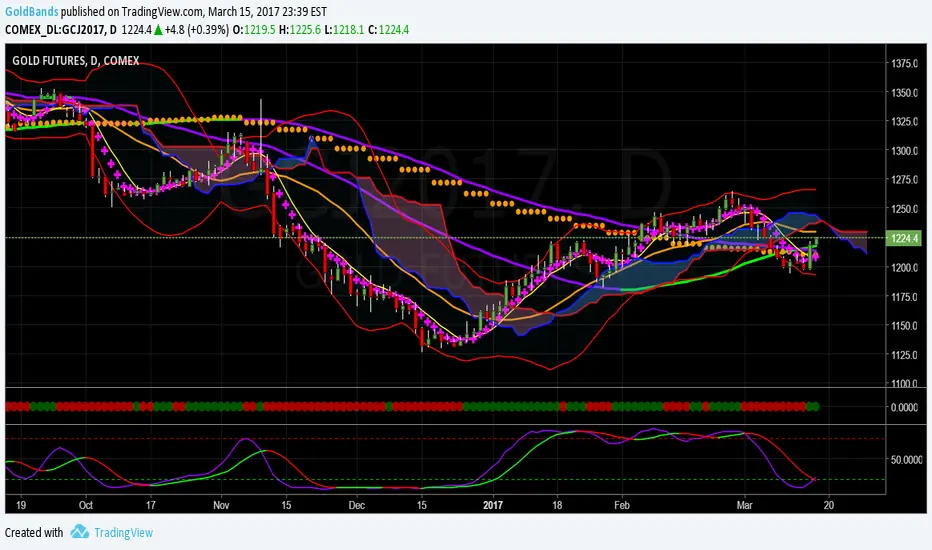
The Fed today announced an increase in the Fed rate. This was not a surprise. What was surprising is the Gold rally that followed. In fact, Gold blasted through all resistance levels, including the 6 and 8 day moving averages, the 50 day moving average and the 21 weekly moving average.
The Heikin-Ashi chart also shows a dramatic change of direction (see below)

Now the question is where is Gold going. First, when price breaks the 6 day moving average, statistically speaking, there is a high probability will price will hit the 21 day moving average. Right now, that's at ~1230. My next target would be the top Bollinger Band. That's currently at 1265. This is what I call a coast to coast trade. After that, well, we'll evaluate that in the days to come.

The last chart tonight is the Volume Profile chart. Notice that the short and intermediate term POC is at 1230. This will act like a magnet to price and makes another good target.
Disclaimer: This post is for educational purposes only. Trade at your own risk.
The Heikin-Ashi chart also shows a dramatic change of direction (see below)
Now the question is where is Gold going. First, when price breaks the 6 day moving average, statistically speaking, there is a high probability will price will hit the 21 day moving average. Right now, that's at ~1230. My next target would be the top Bollinger Band. That's currently at 1265. This is what I call a coast to coast trade. After that, well, we'll evaluate that in the days to come.
The last chart tonight is the Volume Profile chart. Notice that the short and intermediate term POC is at 1230. This will act like a magnet to price and makes another good target.
Disclaimer: This post is for educational purposes only. Trade at your own risk.

免责声明
这些信息和出版物并非旨在提供,也不构成TradingView提供或认可的任何形式的财务、投资、交易或其他类型的建议或推荐。请阅读使用条款了解更多信息。