
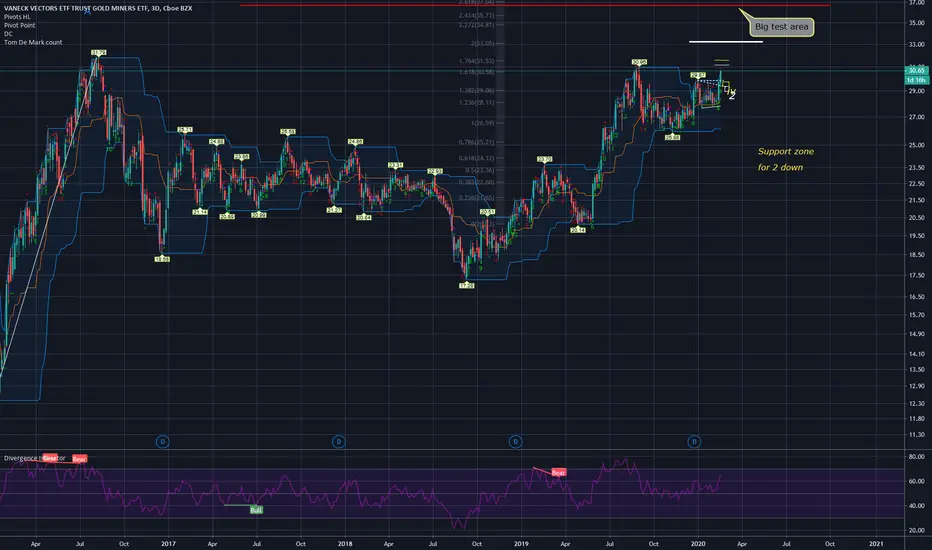
GDX 3 day chart 2/23/20
GDX is nearing a resistance zone. If GDX stops around 32 - 33 area and pulls back to the support zone then I will likely view GDX has a bull market to look forward to for a long term but if GDX extends to the red line around mid 36 area, then pulls back hard, I would view it bearish for GDX. Until now, it's been a fairly easy ride but it's time to buckle up.

GDX is nearing a resistance zone. If GDX stops around 32 - 33 area and pulls back to the support zone then I will likely view GDX has a bull market to look forward to for a long term but if GDX extends to the red line around mid 36 area, then pulls back hard, I would view it bearish for GDX. Until now, it's been a fairly easy ride but it's time to buckle up.
注释
2/27/20Pretty strong, nearly 12% pull back from the rejection of double top area.
Even when
 XAUUSD was trading positive, GDX was trading negative showing that many Miners were weak.
Path_1: Consolidate around here making a bull flag therefore creating Cup & Handle like pattern and go up. It will take some time.
Path_2: Consider a Diagonal count of 5 waves up completed. Now pull back to 24-25 area to build a base again.
注释
GDX 2 hour, 2/28/2020% down so far

免责声明
这些信息和出版物并非旨在提供,也不构成TradingView提供或认可的任何形式的财务、投资、交易或其他类型的建议或推荐。请阅读使用条款了解更多信息。
免责声明
这些信息和出版物并非旨在提供,也不构成TradingView提供或认可的任何形式的财务、投资、交易或其他类型的建议或推荐。请阅读使用条款了解更多信息。