
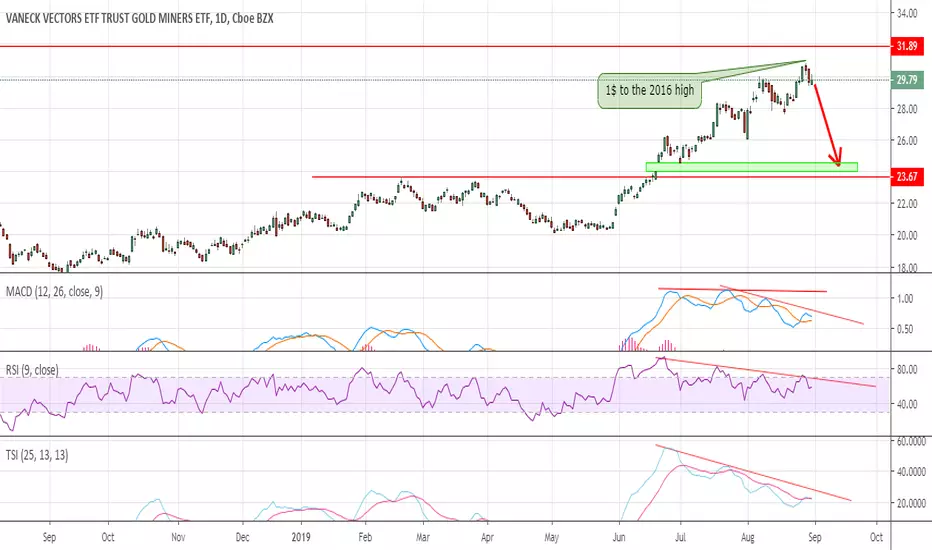
I think the GDX rally is done too.
All the indicators are showing divergencies in GDX.
It rallied almost to the 2016 highs...

We will get a pinbar ( inverted hammer or shooting star ) on the weekly chart.
The weekly chart's indicators need to tag the oversold territory in this decline.
It might close the gap at 24 -24.56 or might test breakout at 23.67$.
All the indicators are showing divergencies in GDX.
It rallied almost to the 2016 highs...
We will get a pinbar ( inverted hammer or shooting star ) on the weekly chart.
The weekly chart's indicators need to tag the oversold territory in this decline.
It might close the gap at 24 -24.56 or might test breakout at 23.67$.
注释
Broke down the trendline today. If it stays there into the close more selling will come on Monday.注释
After today's big bounce we are closing in the red. Big guys dumped their shares to the small guys. I hope nobody bought the fake rally today.
交易手动结束
注释
Just in case if it turns out to be a double bottom
免责声明
这些信息和出版物并非旨在提供,也不构成TradingView提供或认可的任何形式的财务、投资、交易或其他类型的建议或推荐。请阅读使用条款了解更多信息。