
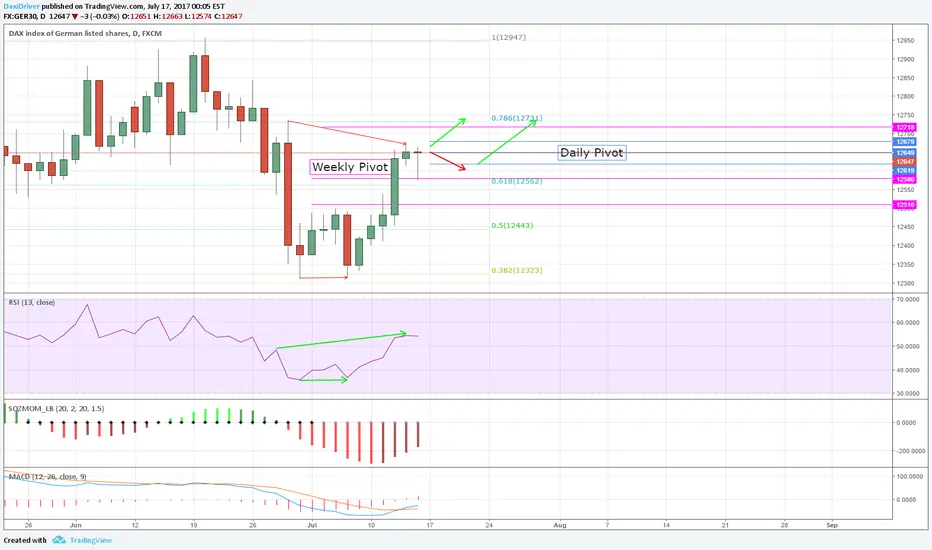
Good morning Traders. How was the weekend ? Another trading week will start soon. so let's dig in.
The daily chart look's BULLISH. with US new high, looks like we heading towards 12730 - 12750.
BUT before we run and buy, we should look deeper
The 2hr chart is more BEARISH, so we can expect so some sell before US market opens.
not to mention that US might sell off a bit after weekend rally.
s3.amazonaws.com/tradingview/snapshots/o/OW62dgK6.png
Remember, you dont have to jump in. you can use the WEEKLY and DAILY pivots to try and enter.
the logic with pivots is - if price goes up towards S1 (top line) you might consider sell if it doesn't go above.
if price goes down towards P1 (bottom line) you can consider LONG if it won't breaks below the line.
The daily chart look's BULLISH. with US new high, looks like we heading towards 12730 - 12750.
BUT before we run and buy, we should look deeper
The 2hr chart is more BEARISH, so we can expect so some sell before US market opens.
not to mention that US might sell off a bit after weekend rally.
s3.amazonaws.com/tradingview/snapshots/o/OW62dgK6.png
Remember, you dont have to jump in. you can use the WEEKLY and DAILY pivots to try and enter.
the logic with pivots is - if price goes up towards S1 (top line) you might consider sell if it doesn't go above.
if price goes down towards P1 (bottom line) you can consider LONG if it won't breaks below the line.
注释
I think its going upS&p got more 10 points to give
s3.amazonaws.com/tradingview/snapshots/5/5SBrc3TG.png

免责声明
这些信息和出版物并非旨在提供,也不构成TradingView提供或认可的任何形式的财务、投资、交易或其他类型的建议或推荐。请阅读使用条款了解更多信息。
免责声明
这些信息和出版物并非旨在提供,也不构成TradingView提供或认可的任何形式的财务、投资、交易或其他类型的建议或推荐。请阅读使用条款了解更多信息。