做空
Ger30 Short
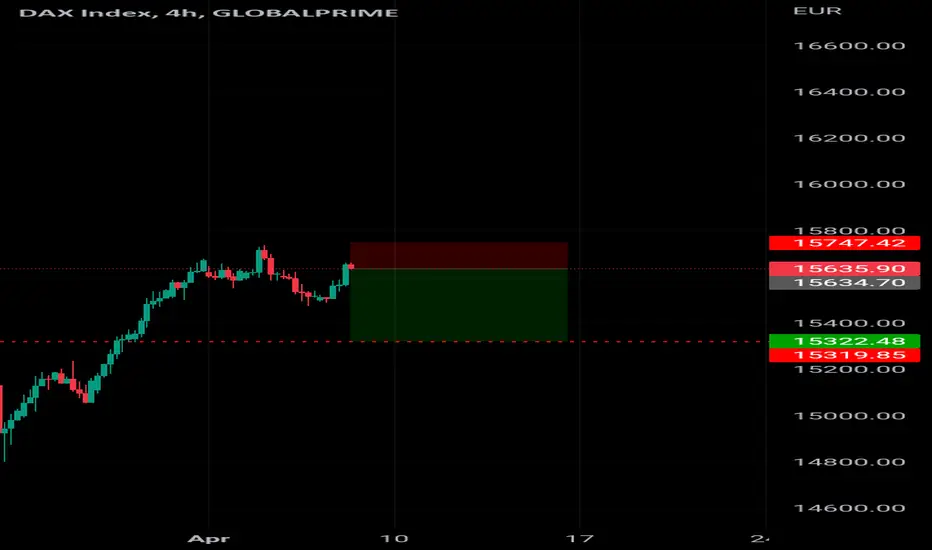
Ger30 Short potential
Short it now
The GER30 daily chart is trading in its bullish channel between its upper blue and red bands. It RSI is trading above 50 (green rectangle). The longer it maintains on the bullish side of 50 the greater the probability of higher prices ahead.
The hourly chart shows a strong start to today's trade. The trend following EMAs and the momentum-based stochastic have turned up (black ellipses). If the stochastic makes its way to the 80+ levels (blue arrow) and holds it will denote a strong underlying bullish momentum is present.

免责声明
这些信息和出版物并非旨在提供,也不构成TradingView提供或认可的任何形式的财务、投资、交易或其他类型的建议或推荐。请阅读使用条款了解更多信息。