
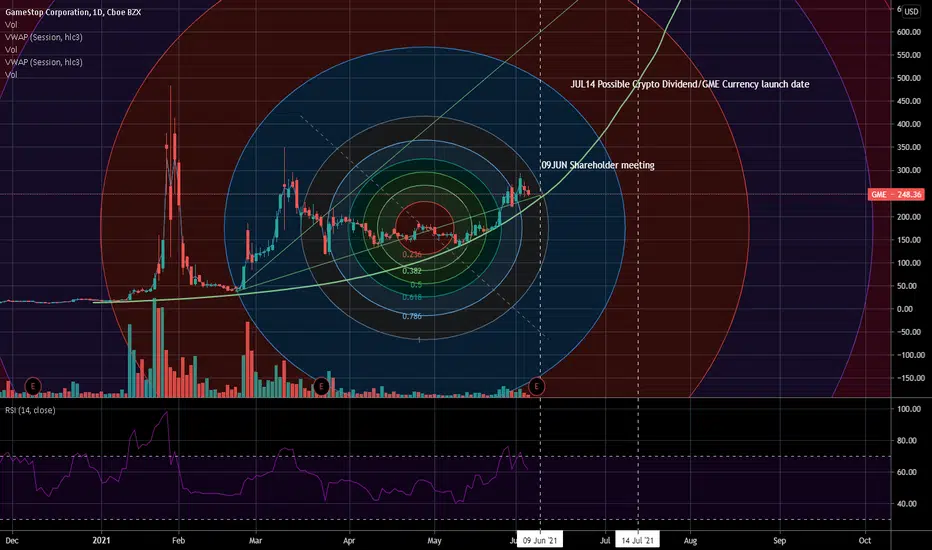
Fib retracement levels are matching perfectly with a price floor trend line drawn on the logarithmic chart. Intra-day Technical Analysis is voodoo at best on GME, but the daily chart shows undeniable patterns drawn over the longer term. My last prediction about Wyckoff accumulation was spot on, and I believe this Fibonacci circles also show GME's potential due to the myriad of factors surrounding the GameStop short squeeze. Volume has entirely dried up in comparison to earlier this year. High-frequency algorithmic trading of Rehypothecated shares, alongside retail "hodling" pressure show that "just up" is an accurate statement in regards to GME.
注释
Unfortunately, this didn't pan out - There is another fib circle retracement line coming up soon around November. Possibly see movement around there.
免责声明
这些信息和出版物并非旨在提供,也不构成TradingView提供或认可的任何形式的财务、投资、交易或其他类型的建议或推荐。请阅读使用条款了解更多信息。
免责声明
这些信息和出版物并非旨在提供,也不构成TradingView提供或认可的任何形式的财务、投资、交易或其他类型的建议或推荐。请阅读使用条款了解更多信息。