
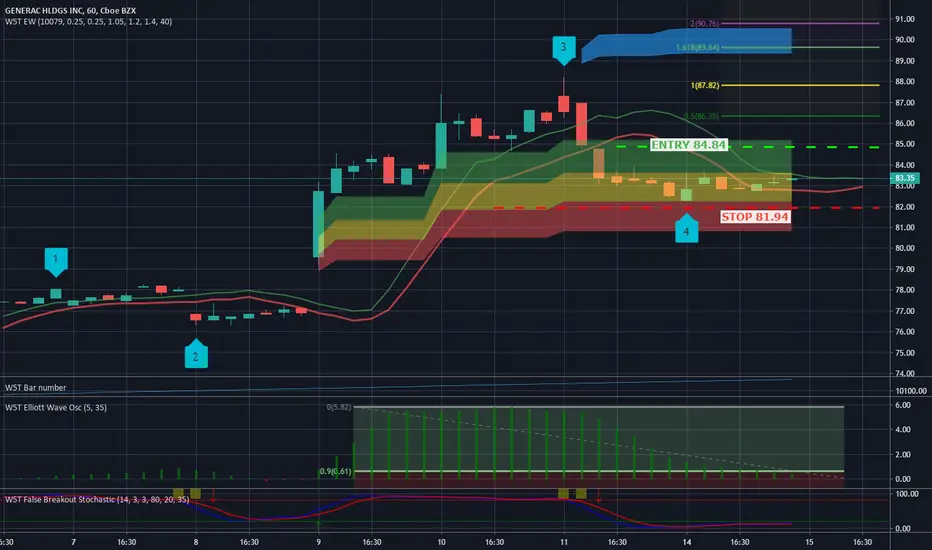
Using our Elliott Wave Indicator Suite for the TradingView platform we have identified a potential Long Swing Trading opportunity for GNRC on the 1 Hr timeframe. This potential 5th wave long has to breakout today for the trade to be effective before the end of the week.
Wave 4 pull back has found support in our Amber pullback zone, which represent an 80% probability of our automated 5th wave target zone at $90 being hit. The Stochastic has crossed in the oversold zone against false breakout dots in overbought zone and Elliott Wave Oscillator has just moved below 90%. These three combined present a high probability move, but we must enter today when price moves up through $84.84.
Learn more about our Elliott Wave Indicator Suite for TradingView by watching the Video Tour >>>HERE<<<
Wave 4 pull back has found support in our Amber pullback zone, which represent an 80% probability of our automated 5th wave target zone at $90 being hit. The Stochastic has crossed in the oversold zone against false breakout dots in overbought zone and Elliott Wave Oscillator has just moved below 90%. These three combined present a high probability move, but we must enter today when price moves up through $84.84.
Learn more about our Elliott Wave Indicator Suite for TradingView by watching the Video Tour >>>HERE<<<

Learn more and subscribe here! thexbrat.com/
免责声明
这些信息和出版物并非旨在提供,也不构成TradingView提供或认可的任何形式的财务、投资、交易或其他类型的建议或推荐。请阅读使用条款了解更多信息。
Learn more and subscribe here! thexbrat.com/
免责声明
这些信息和出版物并非旨在提供,也不构成TradingView提供或认可的任何形式的财务、投资、交易或其他类型的建议或推荐。请阅读使用条款了解更多信息。