GOBTC Chart Analysis
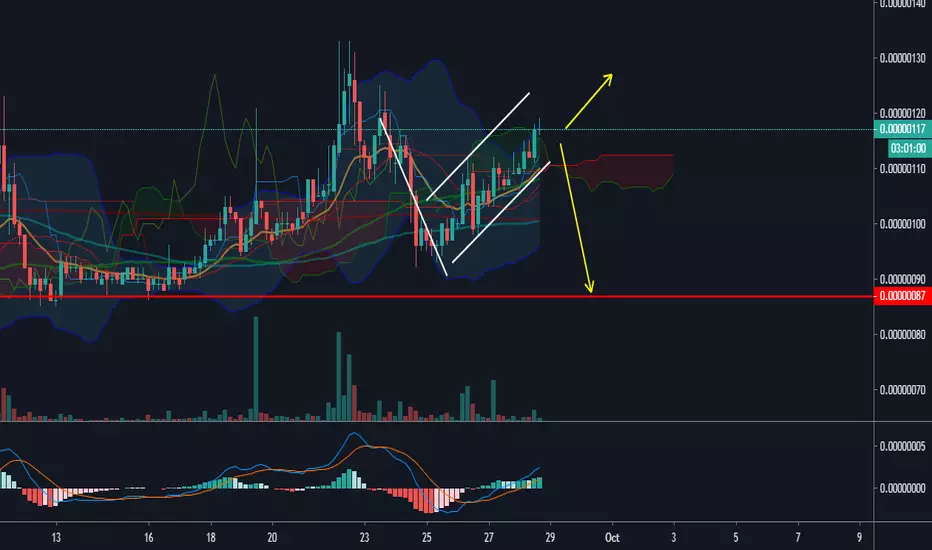
It is possible that, after a little rise, it will fall back to the support line.
Another possibility is that from the next candle, without rising, reach to the same line.
The flag pattern and the reduction of the volume of transactions in the chart are clear.
Another possibility is that from the next candle, without rising, reach to the same line.
The flag pattern and the reduction of the volume of transactions in the chart are clear.

免责声明
这些信息和出版物并非旨在提供,也不构成TradingView提供或认可的任何形式的财务、投资、交易或其他类型的建议或推荐。请阅读使用条款了解更多信息。
免责声明
这些信息和出版物并非旨在提供,也不构成TradingView提供或认可的任何形式的财务、投资、交易或其他类型的建议或推荐。请阅读使用条款了解更多信息。