
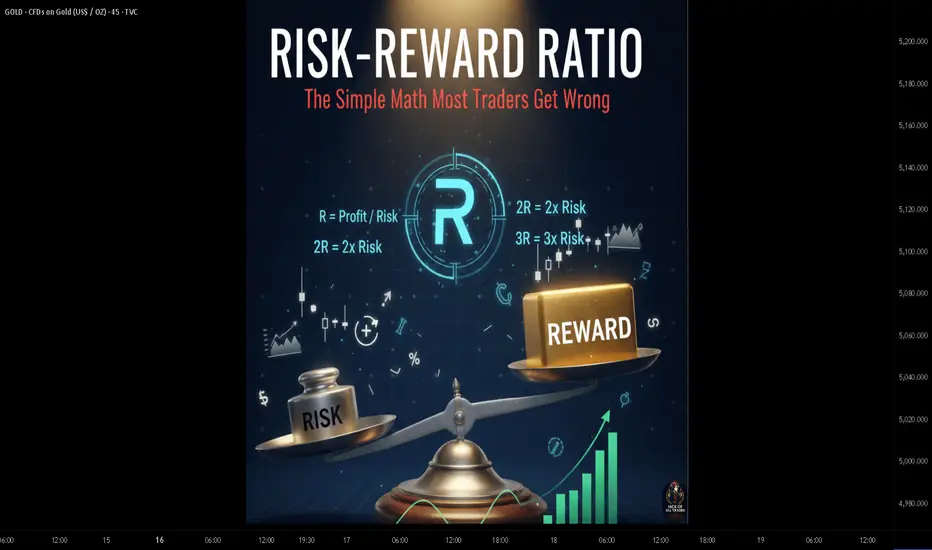
You Can Be Wrong 60% of the Time and Still Make Money
Most traders obsess over win rate.
"I need to be right more often."
But here's the math that changes everything:
A trader who wins 40% of the time with 3:1 risk-reward makes more money than a trader who wins 60% of the time with 1:1 risk-reward.
Let's break down why.
What Is Risk-Reward Ratio?
Definition:
Risk-reward ratio compares the potential profit of a trade to its potential loss.
Formula:
Risk-Reward Ratio = Potential Reward / Potential Risk
Example:
Meaning: You're risking $1 to potentially make $3.
The R-Multiple Framework
What Is R?
R = Your initial risk on a trade
R-Multiple:
How many R's you made or lost on a trade.
Examples:
Why R-Multiples Matter:
They normalize results across different position sizes and allow meaningful comparison.
The Math of Expectancy
Expectancy Formula:
Expectancy = (Win Rate × Average Win) - (Loss Rate × Average Loss)
In R-Terms:
Expectancy = (Win Rate × Avg R on Wins) - (Loss Rate × Avg R on Losses)
Example 1: High Win Rate, Low R
Example 2: Low Win Rate, High R
The Insight:
Example 2 has LOWER win rate but HIGHER expectancy.
Win Rate vs Risk-Reward Tradeoff
There's typically an inverse relationship:
The Question:
What combination maximizes expectancy?
Breakeven Win Rates by R:R:
Why Most Traders Get This Wrong
Mistake 1: Chasing Win Rate
Mistake 2: Ignoring Risk
Mistake 3: Moving Targets
Mistake 4: Not Tracking R-Multiples
Setting Realistic Risk-Reward Targets
Factor 1: Market Structure
Factor 2: Volatility
Factor 3: Timeframe
Factor 4: Historical Analysis
Risk-Reward Strategies
Strategy 1: Fixed R:R
Always target the same R:R ratio.
Example:
Pros: Easy to implement, consistent
Cons: May not match market structure
Strategy 2: Structure-Based Targets
Set targets based on chart structure.
Example:
Pros: Logical targets, adapts to market
Cons: Variable R:R, requires analysis
Strategy 3: Scaled Exits
Take profits at multiple levels.
Example:
Pros: Locks in some profit, lets rest run
Cons: More complex, average R may be lower
Strategy 4: Trailing for Extended R
Use trailing stops to capture large moves.
Example:
Pros: Captures outlier wins
Cons: Gives back some profit on reversals
AI-Enhanced Risk-Reward Optimization
1. Optimal Target Calculation
AI analyzes historical data to find:
2. Dynamic R:R Adjustment
AI adjusts targets based on:
3. Probability-Weighted Targets
AI calculates:
4. Trade Filtering
AI filters trades by R:R potential:
Tracking Your R-Multiples
What to Track:
Analysis Questions:
Risk-Reward Reality Check
Unrealistic Expectations:
Realistic Expectations:
The R-Multiple Mindset
Think in R, Not Dollars:
Focus on Expectancy, Not Win Rate:
Accept Losses as Cost of Business:
Key Takeaways
Your Turn
What risk-reward ratio do you typically target?
Do you track your trades in R-multiples?
Share your approach below 👇
Most traders obsess over win rate.
"I need to be right more often."
But here's the math that changes everything:
A trader who wins 40% of the time with 3:1 risk-reward makes more money than a trader who wins 60% of the time with 1:1 risk-reward.
Let's break down why.
What Is Risk-Reward Ratio?
Definition:
Risk-reward ratio compares the potential profit of a trade to its potential loss.
Formula:
Risk-Reward Ratio = Potential Reward / Potential Risk
Example:
- Entry: $100
- Stop Loss: $95 (Risk = $5)
- Target: $115 (Reward = $15)
- Risk-Reward = $15 / $5 = 3:1
Meaning: You're risking $1 to potentially make $3.
The R-Multiple Framework
What Is R?
R = Your initial risk on a trade
R-Multiple:
How many R's you made or lost on a trade.
Examples:
- Risk $100, make $300 = +3R
- Risk $100, lose $100 = -1R
- Risk $100, make $50 = +0.5R
- Risk $100, lose $50 = -0.5R
Why R-Multiples Matter:
They normalize results across different position sizes and allow meaningful comparison.
The Math of Expectancy
Expectancy Formula:
Expectancy = (Win Rate × Average Win) - (Loss Rate × Average Loss)
In R-Terms:
Expectancy = (Win Rate × Avg R on Wins) - (Loss Rate × Avg R on Losses)
Example 1: High Win Rate, Low R
- Win Rate: 70%
- Average Win: 1R
- Average Loss: 1R
- Expectancy = (0.70 × 1) - (0.30 × 1) = 0.40R per trade
Example 2: Low Win Rate, High R
- Win Rate: 40%
- Average Win: 3R
- Average Loss: 1R
- Expectancy = (0.40 × 3) - (0.60 × 1) = 0.60R per trade
The Insight:
Example 2 has LOWER win rate but HIGHER expectancy.
Win Rate vs Risk-Reward Tradeoff
There's typically an inverse relationship:
- Tighter targets = Higher win rate, lower R
- Wider targets = Lower win rate, higher R
The Question:
What combination maximizes expectancy?
Breakeven Win Rates by R:R:
- 1:1 R:R → Need 50% win rate to break even
- 2:1 R:R → Need 33% win rate to break even
- 3:1 R:R → Need 25% win rate to break even
- 4:1 R:R → Need 20% win rate to break even
- 5:1 R:R → Need 17% win rate to break even
Why Most Traders Get This Wrong
Mistake 1: Chasing Win Rate
- Taking profits too early to "lock in wins"
- Turning potential 3R winners into 0.5R winners
- High win rate, low expectancy
Mistake 2: Ignoring Risk
- No stop loss = undefined risk
- Can't calculate R:R without knowing risk
- One bad trade wipes out many winners
Mistake 3: Moving Targets
- Changing target based on emotions
- Exiting early out of fear
- Holding losers hoping they'll recover
Mistake 4: Not Tracking R-Multiples
- Only tracking P&L in dollars
- Can't identify if R:R is working
- No data for optimization
Setting Realistic Risk-Reward Targets
Factor 1: Market Structure
- Where is the next support/resistance?
- Is there room for your target?
- Don't set targets beyond logical levels
Factor 2: Volatility
- Higher volatility = wider stops needed
- Targets should scale with volatility
- Use ATR to calibrate
Factor 3: Timeframe
- Longer timeframes = larger moves possible
- Shorter timeframes = tighter targets
- Match R:R to timeframe
Factor 4: Historical Analysis
- What R:R has your strategy achieved historically?
- What's realistic for this setup type?
- Don't assume unrealistic R:R
Risk-Reward Strategies
Strategy 1: Fixed R:R
Always target the same R:R ratio.
Example:
- Always target 2:1
- Risk $100, target $200
- Simple, consistent
Pros: Easy to implement, consistent
Cons: May not match market structure
Strategy 2: Structure-Based Targets
Set targets based on chart structure.
Example:
- Target = Next resistance level
- Only take trade if R:R > 2:1
- Skip trades with poor R:R
Pros: Logical targets, adapts to market
Cons: Variable R:R, requires analysis
Strategy 3: Scaled Exits
Take profits at multiple levels.
Example:
- 1/3 at 1R
- 1/3 at 2R
- 1/3 trailing
Pros: Locks in some profit, lets rest run
Cons: More complex, average R may be lower
Strategy 4: Trailing for Extended R
Use trailing stops to capture large moves.
Example:
- Initial target: 2R
- If reached, switch to trailing stop
- Potential for 5R+ on big moves
Pros: Captures outlier wins
Cons: Gives back some profit on reversals
AI-Enhanced Risk-Reward Optimization
1. Optimal Target Calculation
AI analyzes historical data to find:
- What R:R maximizes expectancy for this setup?
- Where do most winning trades reach?
- Where do most losing trades reverse?
2. Dynamic R:R Adjustment
AI adjusts targets based on:
- Current volatility
- Market regime
- Time of day
- Recent performance
3. Probability-Weighted Targets
AI calculates:
- Probability of reaching 1R, 2R, 3R
- Expected value at each target
- Optimal exit strategy
4. Trade Filtering
AI filters trades by R:R potential:
- Only take trades with R:R > threshold
- Rank setups by expected R
- Allocate more to higher R:R opportunities
Tracking Your R-Multiples
What to Track:
- Initial R (risk) for each trade
- Actual R achieved (positive or negative)
- Average R on winners
- Average R on losers
- Expectancy in R
Analysis Questions:
- What's my average winning R?
- Am I cutting winners too short?
- Am I letting losers run too long?
- What R:R setups perform best?
Risk-Reward Reality Check
Unrealistic Expectations:
- "I only take 5:1 trades" — These are rare
- "I never lose more than 0.5R" — Slippage happens
- "My average win is 4R" — Verify with data
Realistic Expectations:
- Average R on winners: 1.5-2.5R is good
- Average R on losers: -0.8 to -1.2R is normal
- Expectancy: 0.2-0.5R per trade is solid
The R-Multiple Mindset
Think in R, Not Dollars:
- "I made 2R" not "I made $500"
- "I lost 1R" not "I lost $250"
- Normalizes across different position sizes
Focus on Expectancy, Not Win Rate:
- A losing streak doesn't mean the system is broken
- If expectancy is positive, results will come
- Trust the math over short-term results
Accept Losses as Cost of Business:
- -1R losses are expected and planned
- They're the "cost" of being in the game
- Winners more than compensate
Key Takeaways
- Risk-reward ratio matters more than win rate for profitability
- R-multiples normalize results and enable meaningful analysis
- Expectancy = (Win Rate × Avg Win R) - (Loss Rate × Avg Loss R)
- You can be wrong more than half the time and still profit with good R:R
- Track R-multiples religiously to optimize your trading
Your Turn
What risk-reward ratio do you typically target?
Do you track your trades in R-multiples?
Share your approach below 👇

The Institutional Grade Trading Ecosystem, Built to win trades 📈
Get Access 👇
jackofalltrades.vip 🌐
t.me/jackofalltradesvip 🃏
Get Access 👇
jackofalltrades.vip 🌐
t.me/jackofalltradesvip 🃏
免责声明
这些信息和出版物并非旨在提供,也不构成TradingView提供或认可的任何形式的财务、投资、交易或其他类型的建议或推荐。请阅读使用条款了解更多信息。
The Institutional Grade Trading Ecosystem, Built to win trades 📈
Get Access 👇
jackofalltrades.vip 🌐
t.me/jackofalltradesvip 🃏
Get Access 👇
jackofalltrades.vip 🌐
t.me/jackofalltradesvip 🃏
免责声明
这些信息和出版物并非旨在提供,也不构成TradingView提供或认可的任何形式的财务、投资、交易或其他类型的建议或推荐。请阅读使用条款了解更多信息。