
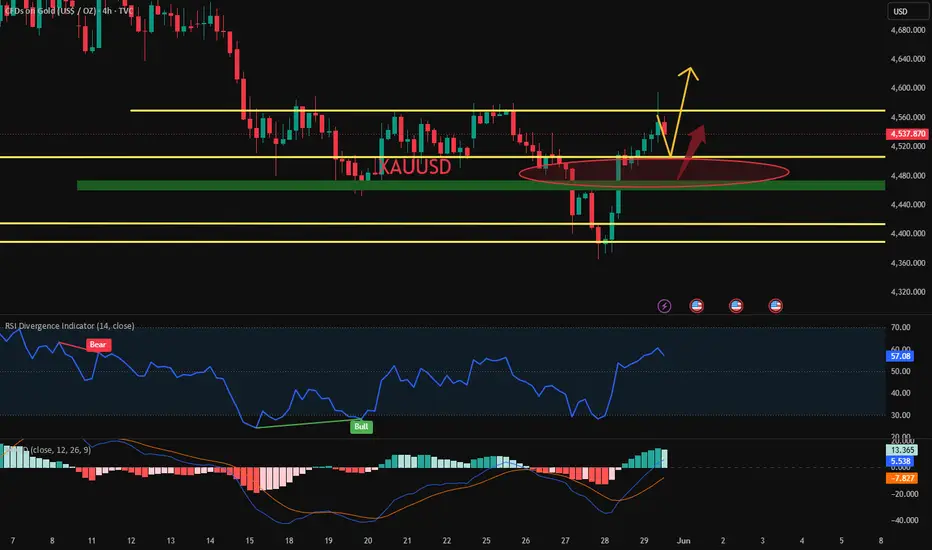
4-hour chart: The bottoming pattern has been confirmed, and a reversal is underway. The Moving Averages (MA) have formed a "Golden Cross," and the price is trading above the support level. The MACD indicator has formed a bullish golden cross below the zero line, indicating that upward momentum is accumulating. However, gold prices encountered slight selling pressure around $4,594, causing the upward momentum to slow. Monday's market movement is expected to be a corrective pattern of fluctuating upward movement. 1-hour chart: After a surge, the price has entered a consolidation phase; short-term moving averages are intertwined – the bulls and bears are in a state of evenly matched struggle. The key support level is located in the 4510–4500 range (this is a key area for defending against pullbacks). The immediate resistance level is located in the 4595–4595–4600 range; if this resistance is broken effectively, the upside potential will open up to $4650. Monday's Trading Strategy:
Main Tactics: Sell on rallies, buy on dips. Key resistance level: 4565–4575
Key support level: 4480
– 4480–4450 Scalp entry points:
Sell on a rebound: Enter in the 4590-4600 range; if the rebound continues, add to the short position in the 4640-4640-4650 range.
Buy on pullback: Enter in the 4500-4510 range; if the pullback continues, add to your long position in the 4480-4480-4470 range.

免责声明
这些信息和出版物并非旨在提供,也不构成TradingView提供或认可的任何形式的财务、投资、交易或其他类型的建议或推荐。请阅读使用条款了解更多信息。
免责声明
这些信息和出版物并非旨在提供,也不构成TradingView提供或认可的任何形式的财务、投资、交易或其他类型的建议或推荐。请阅读使用条款了解更多信息。