
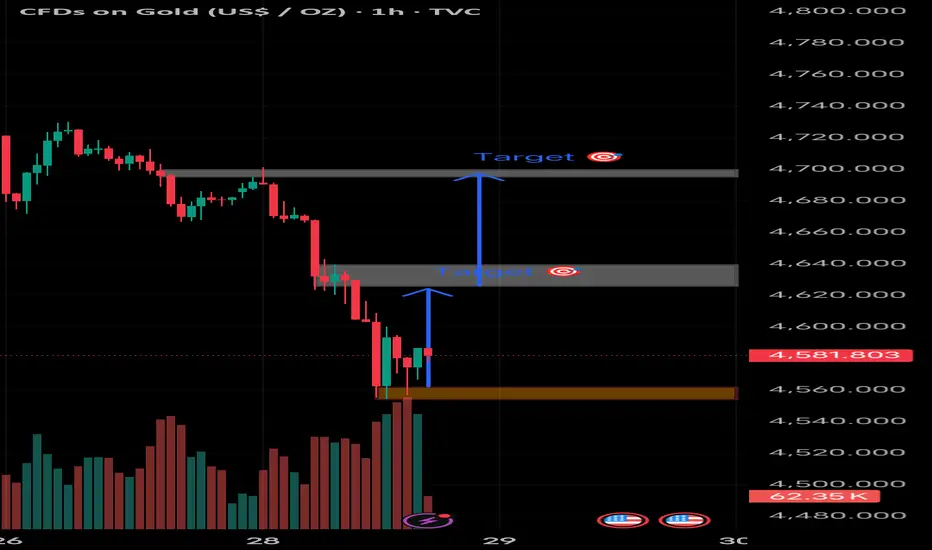
1H Chart 4,550–4,560 and I have marked two upside targets. Based on that structure:
Short-term upside targets:
Target 1: 4,620–4,640 (first supply / reaction zone)
Target 2: 4,690–4,710 (major resistance / previous breakdown area)
How to think about it:
The first target is the most realistic if this is just a relief bounce in a downtrend.
The second target likely needs stronger momentum or a shift in structure (higher highs forming).
Important context:
Trend is still bearish (clear lower highs + strong selloff), so these are counter-trend targets unless structure flips.
If price loses 4,550, my setup is invalid and downside continuation is likely.
Short-term upside targets:
Target 1: 4,620–4,640 (first supply / reaction zone)
Target 2: 4,690–4,710 (major resistance / previous breakdown area)
How to think about it:
The first target is the most realistic if this is just a relief bounce in a downtrend.
The second target likely needs stronger momentum or a shift in structure (higher highs forming).
Important context:
Trend is still bearish (clear lower highs + strong selloff), so these are counter-trend targets unless structure flips.
If price loses 4,550, my setup is invalid and downside continuation is likely.

相关出版物
免责声明
这些信息和出版物并非旨在提供,也不构成TradingView提供或认可的任何形式的财务、投资、交易或其他类型的建议或推荐。请阅读使用条款了解更多信息。