
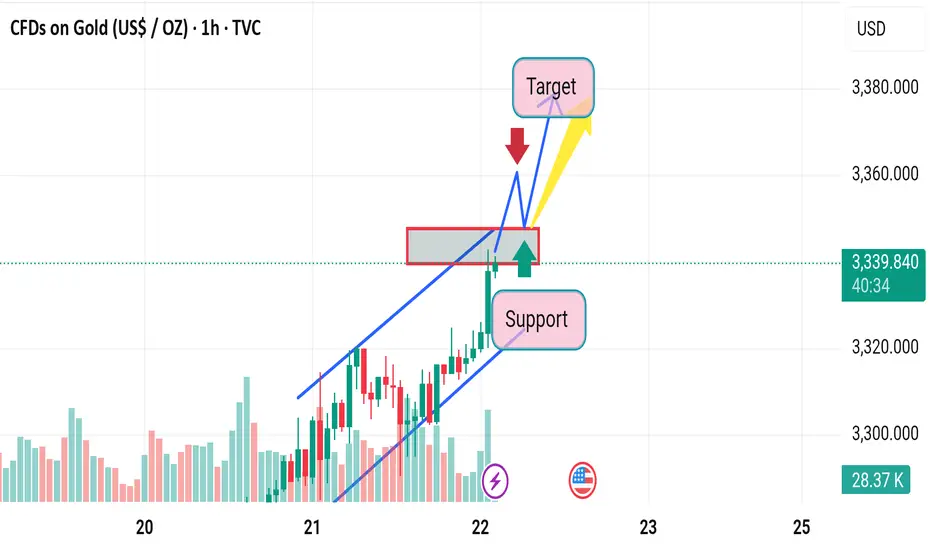
Disruption (Bearish/Contrarian Outlook):
1. Bearish Divergence:
If RSI or MACD (not shown) is diverging (price making higher highs, indicator making lower highs), this could signal weakness in the uptrend.
2. Rising Wedge Pattern:
The channel might be interpreted as a rising wedge, which is often a bearish reversal pattern, especially if volume declines as price rises.
3. Strong Resistance Zone:
The red rectangular zone could act as major resistance, potentially causing a false breakout or rejection rather than continuation.
4. Volume Discrepancy:
Despite the bullish move, if volume is not increasing proportionally, it might indicate a lack of conviction.
5. Potential Breakdown Path:
Price breaks below the support zone (blue trendline).
Falls to test the previous consolidation zone around $3,300 or lower.
Bearish Scenario Path (Disrupted View):
Red arrow moves sharply down through support.
New target: $3,300 or lower (next visible support).
1. Bearish Divergence:
If RSI or MACD (not shown) is diverging (price making higher highs, indicator making lower highs), this could signal weakness in the uptrend.
2. Rising Wedge Pattern:
The channel might be interpreted as a rising wedge, which is often a bearish reversal pattern, especially if volume declines as price rises.
3. Strong Resistance Zone:
The red rectangular zone could act as major resistance, potentially causing a false breakout or rejection rather than continuation.
4. Volume Discrepancy:
Despite the bullish move, if volume is not increasing proportionally, it might indicate a lack of conviction.
5. Potential Breakdown Path:
Price breaks below the support zone (blue trendline).
Falls to test the previous consolidation zone around $3,300 or lower.
Bearish Scenario Path (Disrupted View):
Red arrow moves sharply down through support.
New target: $3,300 or lower (next visible support).

免责声明
这些信息和出版物并非旨在提供,也不构成TradingView提供或认可的任何形式的财务、投资、交易或其他类型的建议或推荐。请阅读使用条款了解更多信息。
免责声明
这些信息和出版物并非旨在提供,也不构成TradingView提供或认可的任何形式的财务、投资、交易或其他类型的建议或推荐。请阅读使用条款了解更多信息。