
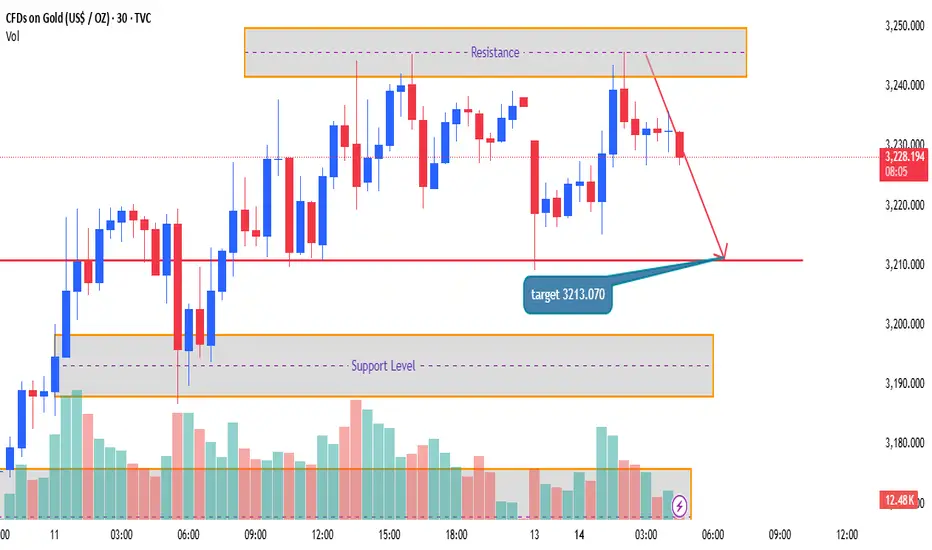
The chart shows price moving in a tight consolidation zone between the resistance area near 3,245 and support at3,213. While the price has tested the resistance multiple times, it has failed to break out decisively, indicating possible bearish weakness emerging.
---
🔍 Discrepation Zones (Key Conflicts):
1. Price vs. Resistance Reaction
- Expected: Breakout continuation above $3,245 due to repeated testing.
- Actual: Price rejected again after touching resistance.
- Discrepation: Buyers are unable to sustain upward momentum, revealing fading bullish strength despite frequent attempts.
---
2. Volume Behavior vs. Price Actio…
This hidden bearishness suggests sellers may be stepping in before each breakout attempt completes.
—
4. Target Discrepancy at3213.070
- While current price appears stable, the projection clearly anticipates a pullback to 3213.070.
- This level sits just above a major support block, marking a key imbalance between current consolidation and the expected move down.
—
🧭 Discrepation Summary Table:
| Element | Expected Behavior | Observed Behavior | Discrepation |
|————————–|——————————-|————————————-|———————————————|
| Resistance Test | Breakout after repeated tests | Another rejection | Buyers failing to gain momentum |
| Volume Analysis | Increased …
: Gold is showing signs of hidden bearish pressure. Although still inside a range, multiple failed breakout attempts, declining volume, and a projected drop to3213.070 point to a clear discrepation between expected bullish continuation and emerging bearish signals.
📌 Watch how price behaves near the $3,230 level. A decisive break could validate the bearish target, especially if volume increases on the move down.
Let me know if you want this turned into a social post or shorter caption!
---
🔍 Discrepation Zones (Key Conflicts):
1. Price vs. Resistance Reaction
- Expected: Breakout continuation above $3,245 due to repeated testing.
- Actual: Price rejected again after touching resistance.
- Discrepation: Buyers are unable to sustain upward momentum, revealing fading bullish strength despite frequent attempts.
---
2. Volume Behavior vs. Price Actio…
This hidden bearishness suggests sellers may be stepping in before each breakout attempt completes.
—
4. Target Discrepancy at3213.070
- While current price appears stable, the projection clearly anticipates a pullback to 3213.070.
- This level sits just above a major support block, marking a key imbalance between current consolidation and the expected move down.
—
🧭 Discrepation Summary Table:
| Element | Expected Behavior | Observed Behavior | Discrepation |
|————————–|——————————-|————————————-|———————————————|
| Resistance Test | Breakout after repeated tests | Another rejection | Buyers failing to gain momentum |
| Volume Analysis | Increased …
: Gold is showing signs of hidden bearish pressure. Although still inside a range, multiple failed breakout attempts, declining volume, and a projected drop to3213.070 point to a clear discrepation between expected bullish continuation and emerging bearish signals.
📌 Watch how price behaves near the $3,230 level. A decisive break could validate the bearish target, especially if volume increases on the move down.
Let me know if you want this turned into a social post or shorter caption!

免责声明
这些信息和出版物并非旨在提供,也不构成TradingView提供或认可的任何形式的财务、投资、交易或其他类型的建议或推荐。请阅读使用条款了解更多信息。
免责声明
这些信息和出版物并非旨在提供,也不构成TradingView提供或认可的任何形式的财务、投资、交易或其他类型的建议或推荐。请阅读使用条款了解更多信息。