
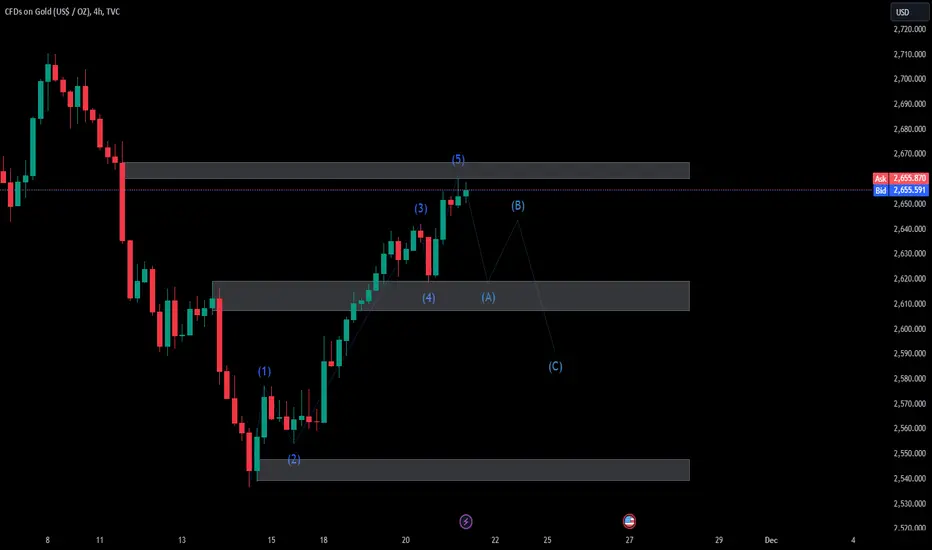
The 4-hour XAU/USD chart shows a completed Elliott Wave (1-5) structure, with wave (5) reaching the $2,655-$2,660 resistance zone, indicating a potential reversal. A corrective ABC pattern is expected:
As gold prices are highly sensitive to macroeconomic events, traders should use proper position sizing and stop-loss levels to mitigate risks. Keep an eye on upcoming economic releases and geopolitical tensions that might affect market volatility.
Good luck
- Wave A: Targeting $2,620-$2,630 (middle support zone).
- Wave B: Minor retracement below $2,655.
- Wave C: Extending to $2,600-$2,610 (lower support).
As gold prices are highly sensitive to macroeconomic events, traders should use proper position sizing and stop-loss levels to mitigate risks. Keep an eye on upcoming economic releases and geopolitical tensions that might affect market volatility.
Good luck
注释
Update new resistance: 交易开始
now price hit resistance so wait drop to make wave A :) but if It break up resistance so find your stop loss
good luck :)
交易结束:到达止损

免责声明
这些信息和出版物并非旨在提供,也不构成TradingView提供或认可的任何形式的财务、投资、交易或其他类型的建议或推荐。请阅读使用条款了解更多信息。