
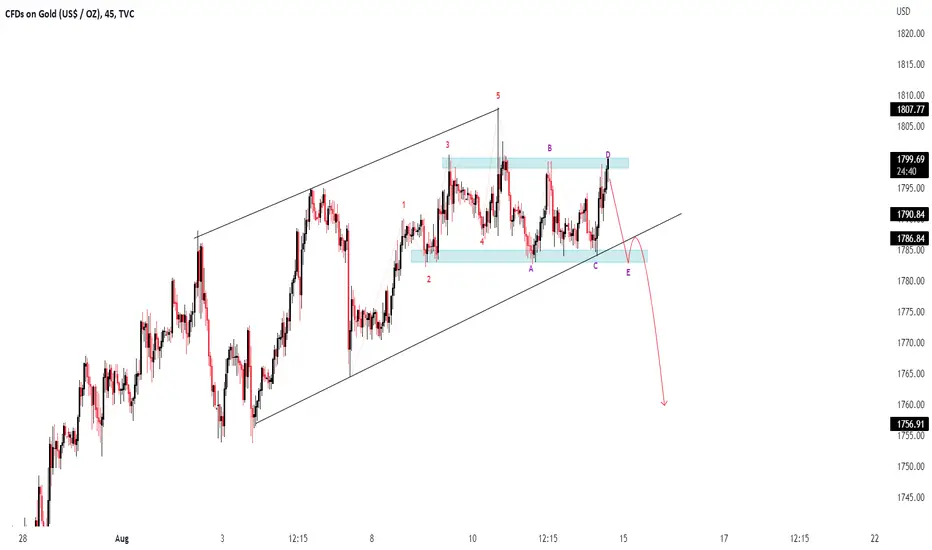
XAU/USD ( Gold / U.S Dollar ) Technical Analysis Chart Update
Time Frame - M45
According to the Pattern in Short Time Frame #STF ( #Bullish Channel ) it failed to Break the Strong Resistance Level #1798-9
According to Elliot waves it has completed the Impulsive #12345 waves and its now Following Corrective wave #ABCDE it will follow Sell Trend to complete its " E " wave
If it Breaks the Lower Trend Line #LTL and Retest it will follow More Sell

免责声明
这些信息和出版物并非旨在提供,也不构成TradingView提供或认可的任何形式的财务、投资、交易或其他类型的建议或推荐。请阅读使用条款了解更多信息。
免责声明
这些信息和出版物并非旨在提供,也不构成TradingView提供或认可的任何形式的财务、投资、交易或其他类型的建议或推荐。请阅读使用条款了解更多信息。