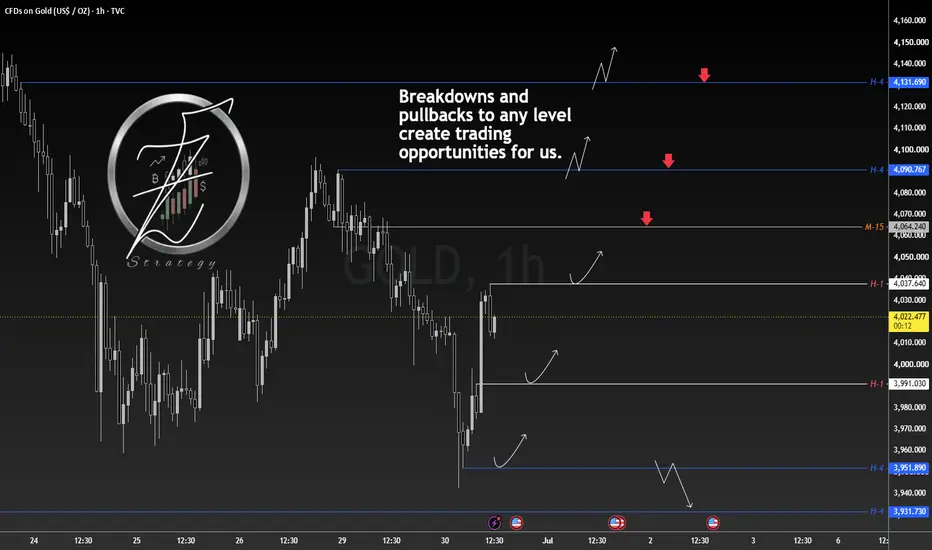
XAUUSD position | H1 Chart (Entry on M15)
Follow price XAUUSD
❇️ Analysis Description: I'm analyzing the 1H timeframe where the blue lines represent major H-4 levels. Every level (H-4, H-1, M-15) is a potential trade opportunity if we get a clean breakout and pullback.
🔼 Buy-sell Setup:
Trending Markets: I look for a 'Pullback Candle' (first candle to break the previous swing's high/low with 80%+ body). Target: Previous untested zones or fixed R:R 2.5.
Ranging Markets: I ignore the overall trend and play the range extremes using the same 'Pullback Candle' logic. Target: R:R 1.5 - 2.0.
🕯 Entry Plan (5-Minute Confirmation):
Follow price
XAUUSD❇️ Analysis Description: I'm analyzing the 1H timeframe where the blue lines represent major H-4 levels. Every level (H-4, H-1, M-15) is a potential trade opportunity if we get a clean breakout and pullback.
🔼 Buy-sell Setup:
Trending Markets: I look for a 'Pullback Candle' (first candle to break the previous swing's high/low with 80%+ body). Target: Previous untested zones or fixed R:R 2.5.
Ranging Markets: I ignore the overall trend and play the range extremes using the same 'Pullback Candle' logic. Target: R:R 1.5 - 2.0.
🕯 Entry Plan (5-Minute Confirmation):
[] Wait for the breakout of the static/dynamic level and the 'Pullback Candle'.
[] Entry: Wait for the retest of the breakout line. Confirm with a price action trigger on the M5 chart.- Stop Loss: Behind the last swing (preferred/safer) or behind the breakout candle.
- [] ⚠️ The 15m timeframe is riskier, but offers better R:R ratios. Stick to your risk management!
[] 💬 What are your thoughts on these levels? Let me know in the comments!
交易开始
交易结束:到达目标
R/R: 2 by setup注释
Reaction to my levels ........
相关出版物
免责声明
这些信息和出版物并非旨在提供,也不构成TradingView提供或认可的任何形式的财务、投资、交易或其他类型的建议或推荐。请阅读使用条款了解更多信息。