
The daily chart for XAU/USD shows that the risk remains skewed to the downside. A bearish 20 Simple Moving Average (SMA) maintains its bearish slope above the current level, while the longer moving averages remain directionless, far below the current level. Technical indicators, in the meantime, hold directionless within negative levels.
According to near-term technical readings, XAU/USD is poised to extend its decline. The 4-hour chart shows the pair met intraday sellers around a mildly bearish 20 SMA while the longer ones grind lower above it. Technical indicators, in the meantime, accelerate lower within negative levels, supporting another leg south on a break below the $2,010 price zone.
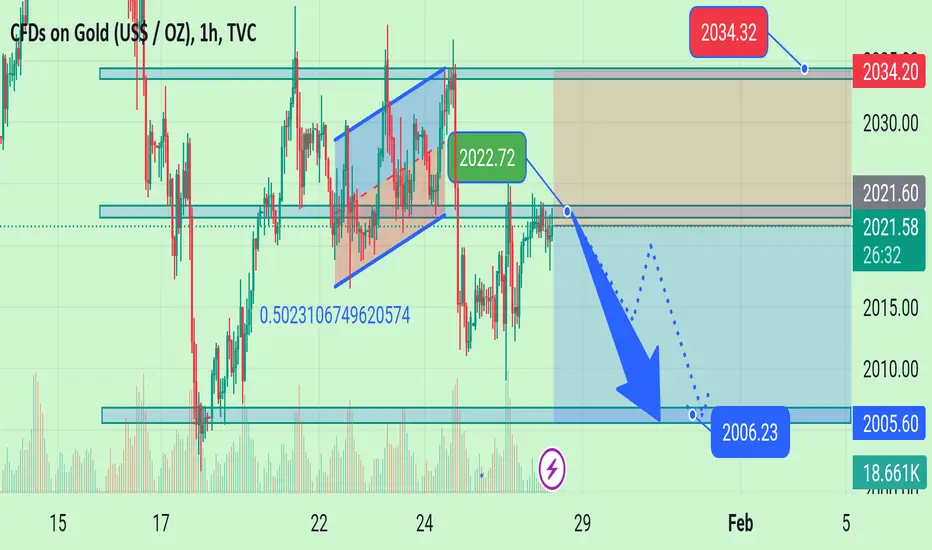
Support levels: 2,010.00 2,001.60 1,988.60
Resistance levels: 2,021.80 2,033.10 2,040.30
Gold sell now 2022
Confirm Target 2005
According to near-term technical readings, XAU/USD is poised to extend its decline. The 4-hour chart shows the pair met intraday sellers around a mildly bearish 20 SMA while the longer ones grind lower above it. Technical indicators, in the meantime, accelerate lower within negative levels, supporting another leg south on a break below the $2,010 price zone.
Support levels: 2,010.00 2,001.60 1,988.60
Resistance levels: 2,021.80 2,033.10 2,040.30
Gold sell now 2022
Confirm Target 2005
注释
20 pips running trade Profit 🔥🔥注释
40 pips done boom boom注释
Guy's support me注释
60 pips running注释
Guy's join my telegram channel注释
Enjoy free chart
免责声明
这些信息和出版物并非旨在提供,也不构成TradingView提供或认可的任何形式的财务、投资、交易或其他类型的建议或推荐。请阅读使用条款了解更多信息。
免责声明
这些信息和出版物并非旨在提供,也不构成TradingView提供或认可的任何形式的财务、投资、交易或其他类型的建议或推荐。请阅读使用条款了解更多信息。