
Dear Traders,
Please find the Gold daily chart attached.
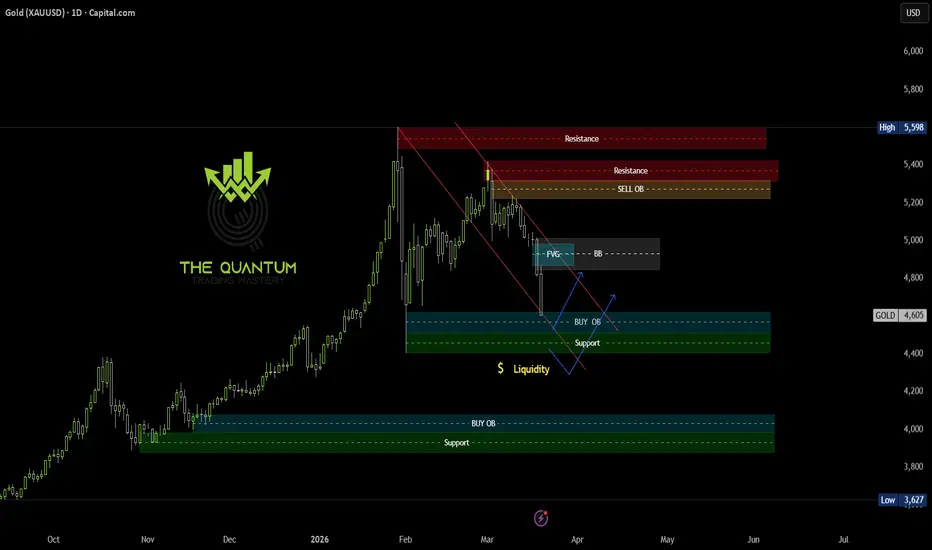
Gold is currently trading around 4626 and has shown significant bearish momentum after retesting the previous high. I have clearly marked the trendline, support zones, and order block (OB) levels for your reference.
Price may bounce back toward the breaker block (BB) level from the support zone, or after a potential liquidity sweep in the 4200–4300 range. Alternatively, price may be rejected from the lower trendline.
Let today’s candle close, then make your trading decision accordingly.
Always look to buy from dip levels, with proper confirmation across multiple confluences. Trade cautiously and apply strong risk management at all times.
The Quantum Trading Mastery
Please find the Gold daily chart attached.
Gold is currently trading around 4626 and has shown significant bearish momentum after retesting the previous high. I have clearly marked the trendline, support zones, and order block (OB) levels for your reference.
Price may bounce back toward the breaker block (BB) level from the support zone, or after a potential liquidity sweep in the 4200–4300 range. Alternatively, price may be rejected from the lower trendline.
Let today’s candle close, then make your trading decision accordingly.
Always look to buy from dip levels, with proper confirmation across multiple confluences. Trade cautiously and apply strong risk management at all times.
The Quantum Trading Mastery
交易开始
The trendline has been broken, the order block has been broken, and the support level has also been broken. Price is now in a liquidity zone.We are waiting for the daily candle to close. If the candle forms a long-wick hammer, it indicates that liquidity has been swept and the price is likely to move bullish. However, if the candle closes below the support level with a strong full body, it suggests the price may continue downward toward the next support level around 4000.
交易结束:到达目标
Perfect, Target Reached
免责声明
这些信息和出版物并非旨在提供,也不构成TradingView提供或认可的任何形式的财务、投资、交易或其他类型的建议或推荐。请阅读使用条款了解更多信息。