
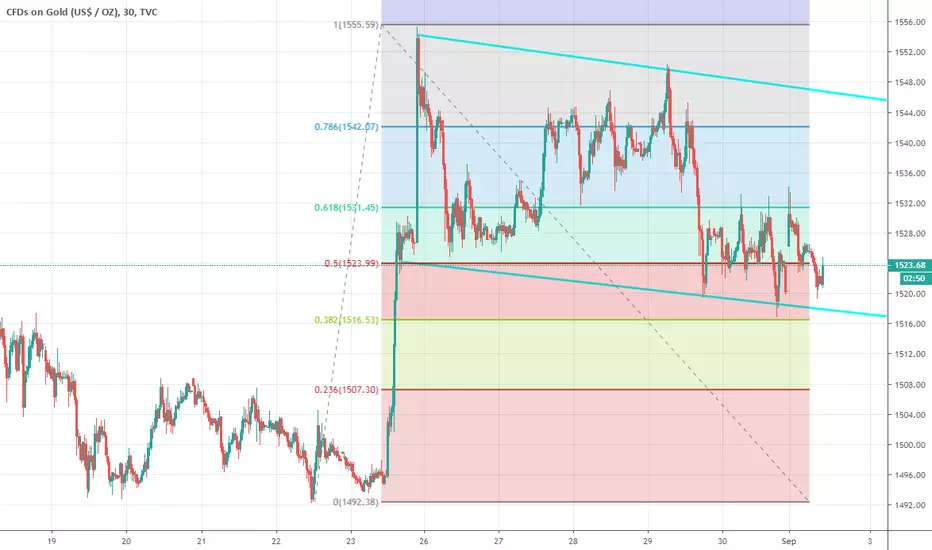
I know this one goes against my previous gold chart, but I think that this one can't be ignored. This looks like a huge/long bull flag on 30 min, price has closed below fib 50 level, which can mean thats it's not valid, but on my MT4 chart this close has been really smal and short, even if that's not a bull flag then it's a nice chanel. keep in mind this one, and remember USD will come down sooner or later. Lets see how this one plays out.
Good luck and enjoy trading!
My telegram small group. t.me/joinchat/KPtBs06gzWxrYDrhCoWGYA
Good luck and enjoy trading!
My telegram small group. t.me/joinchat/KPtBs06gzWxrYDrhCoWGYA
交易开始
Top line touched, Let see if we go back down or we break it and fly.
免责声明
这些信息和出版物并非旨在提供,也不构成TradingView提供或认可的任何形式的财务、投资、交易或其他类型的建议或推荐。请阅读使用条款了解更多信息。