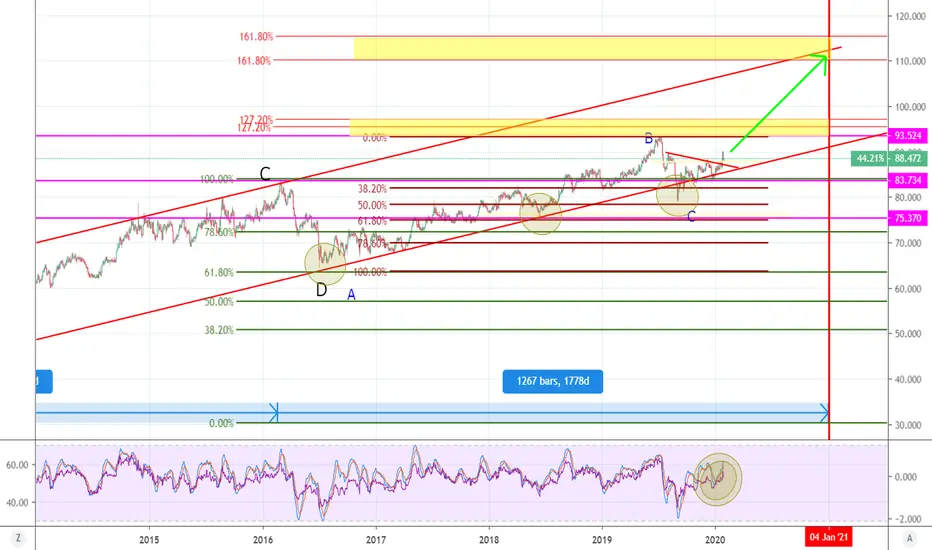
I recently posted a chart of silver showing the bearish case, I also shared a bullish case for the dollar. In order to confirm the theory of those two I share the gold silver ratio. It is obviously in a bull trend. it has been stair stepping up major fib resistance from the low in 2011 and a smaller sequence from 2016. firmly above the 61.8 on both and well positioned in the upward trend lines
-24th jan an obvious break out of the downward sloping wedge with conviction after testing the lower trend line and 50% fib from 2016 low.could even argue it is Head and shoulderish for this break
-MacD and RSI still have room to move before being oversold/overextended.
I see no reason why we cannot push to 100 or even to 110 before year end. this could be a combination of weak silver vs gold with gold not changing or gold moving up and silver not doing much.
time will tell.
-24th jan an obvious break out of the downward sloping wedge with conviction after testing the lower trend line and 50% fib from 2016 low.could even argue it is Head and shoulderish for this break
-MacD and RSI still have room to move before being oversold/overextended.
I see no reason why we cannot push to 100 or even to 110 before year end. this could be a combination of weak silver vs gold with gold not changing or gold moving up and silver not doing much.
time will tell.

免责声明
这些信息和出版物并非旨在提供,也不构成TradingView提供或认可的任何形式的财务、投资、交易或其他类型的建议或推荐。请阅读使用条款了解更多信息。