
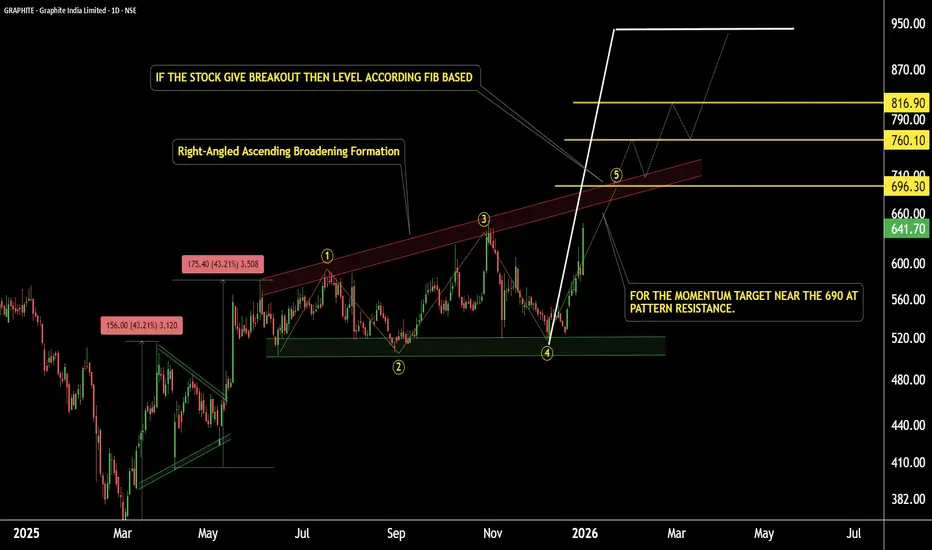
Graphite India – Daily Timeframe Technical View
This is the daily timeframe chart of Graphite India.
The stock has formed a Right-Angled Ascending Broadening Formation, with a strong support zone near 500–520. The broadening structure appears to have completed a five-wave formation, while the key resistance zone is placed near 690–700.
A decisive breakout above the resistance zone, preferably with volume confirmation, could trigger a strong upside move. Based on Fibonacci projections, the final pattern target is placed near 940.
As long as the stock continues to hold above its key support zones, the ongoing rally is likely to continue, keeping the broader trend positive.
Thank you.
This is the daily timeframe chart of Graphite India.
The stock has formed a Right-Angled Ascending Broadening Formation, with a strong support zone near 500–520. The broadening structure appears to have completed a five-wave formation, while the key resistance zone is placed near 690–700.
A decisive breakout above the resistance zone, preferably with volume confirmation, could trigger a strong upside move. Based on Fibonacci projections, the final pattern target is placed near 940.
As long as the stock continues to hold above its key support zones, the ongoing rally is likely to continue, keeping the broader trend positive.
Thank you.

@RahulSarawagi
Connect us at optionlab.co.in/
Connect us at optionlab.co.in/
免责声明
这些信息和出版物并非旨在提供,也不构成TradingView提供或认可的任何形式的财务、投资、交易或其他类型的建议或推荐。请阅读使用条款了解更多信息。
@RahulSarawagi
Connect us at optionlab.co.in/
Connect us at optionlab.co.in/
免责声明
这些信息和出版物并非旨在提供,也不构成TradingView提供或认可的任何形式的财务、投资、交易或其他类型的建议或推荐。请阅读使用条款了解更多信息。