The Graph / Bitcoin
Hello!
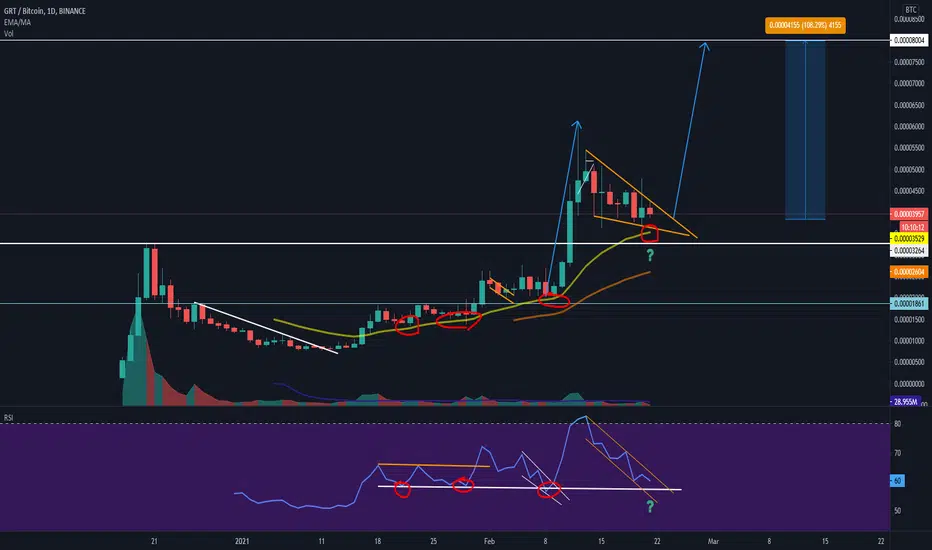
Here we have Grt/Btc once again.
We can see from RSI vertical support line the 20 EMA bounces marked as red
Fourth time a charm or break downwards?
On RSI we can see similar price action like we did on previous break.
The Graph did come out on 17th of December 2020 but they have been working and helping others in the field much longer than that.
If you don't know the project I suggest to check it out.
I did make a analysis about the project already in January 26th
If you do take trades and are not holding for long term use stop loss.
Otherwise you will get your ass burned!
Jebu

相关出版物
免责声明
这些信息和出版物并非旨在提供,也不构成TradingView提供或认可的任何形式的财务、投资、交易或其他类型的建议或推荐。请阅读使用条款了解更多信息。