
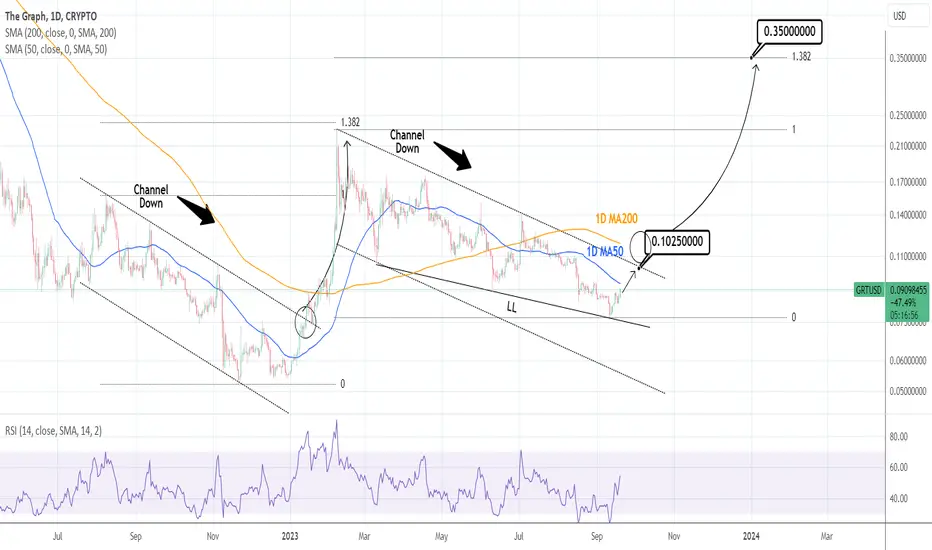
The Graph is on a short term rise with the 1D technicals still neutral (RSI = 53.312, MACD = -0.002, ADX = 25.119) trading towards the 1D MA50. This is the Resistance since the end of July. This is a LL rebound at the bottom of the Rising Wedge pattern which is inside a wider Channel Down.
We are going long now, aiming at the top of the pattern (TP = 0.1025). On the long term, the price needs to cross above the 1D MA200 (as on January 23rd) in order to get a trend change and a breakout bullish signal. Technically the crypto can reach even the 1.382 Fibonacci extension (0.3500) from there.
## If you like our free content follow our profile to get more daily ideas. ##
## Comments and likes are greatly appreciated. ##
We are going long now, aiming at the top of the pattern (TP = 0.1025). On the long term, the price needs to cross above the 1D MA200 (as on January 23rd) in order to get a trend change and a breakout bullish signal. Technically the crypto can reach even the 1.382 Fibonacci extension (0.3500) from there.
## If you like our free content follow our profile to get more daily ideas. ##
## Comments and likes are greatly appreciated. ##

I trade Crypto, Forex, Indices & Commodities all from one account on PrimeXBT with TradingView charts
Register here👉 investingscope.s.gy/PrimeXBT
Contact me for Account Management (+15% monthly profit)
Telegram👉 t.me/investingscope
Register here👉 investingscope.s.gy/PrimeXBT
Contact me for Account Management (+15% monthly profit)
Telegram👉 t.me/investingscope
免责声明
这些信息和出版物并非旨在提供,也不构成TradingView提供或认可的任何形式的财务、投资、交易或其他类型的建议或推荐。请阅读使用条款了解更多信息。
I trade Crypto, Forex, Indices & Commodities all from one account on PrimeXBT with TradingView charts
Register here👉 investingscope.s.gy/PrimeXBT
Contact me for Account Management (+15% monthly profit)
Telegram👉 t.me/investingscope
Register here👉 investingscope.s.gy/PrimeXBT
Contact me for Account Management (+15% monthly profit)
Telegram👉 t.me/investingscope
免责声明
这些信息和出版物并非旨在提供,也不构成TradingView提供或认可的任何形式的财务、投资、交易或其他类型的建议或推荐。请阅读使用条款了解更多信息。