
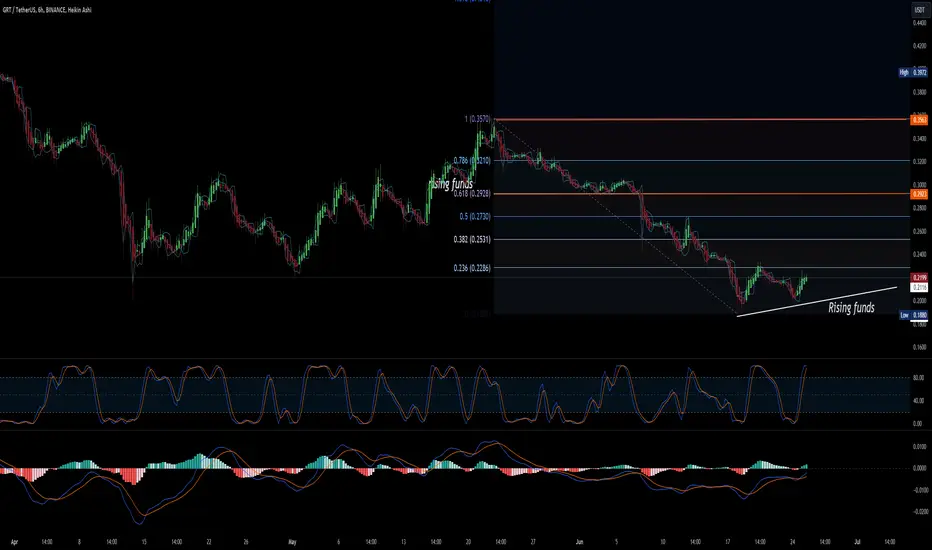
With rising bottoms, GRT rewrites a new graphic pattern, deconstructing the figure of the descending channel
Pattern: The price is approaching resistance, which is a level where it could pause or reverse its recent advance, at least temporarily. Resistance is at 0. Once the price breaks above the resistance, it may move towards the next resistance level at 0.2529. its support zones are: 0.1963 and 0.1875
The short-term trend is bullish.
Pattern: The price is approaching resistance, which is a level where it could pause or reverse its recent advance, at least temporarily. Resistance is at 0. Once the price breaks above the resistance, it may move towards the next resistance level at 0.2529. its support zones are: 0.1963 and 0.1875
The short-term trend is bullish.

Renato Ulianov | Market Analysis & Trading
YouTube: youtube.com/@TradewithRenatoUlianov
Disclaimer: All content is for educational and informational purposes only and does not constitute financial advice.
YouTube: youtube.com/@TradewithRenatoUlianov
Disclaimer: All content is for educational and informational purposes only and does not constitute financial advice.
免责声明
这些信息和出版物并非旨在提供,也不构成TradingView提供或认可的任何形式的财务、投资、交易或其他类型的建议或推荐。请阅读使用条款了解更多信息。
Renato Ulianov | Market Analysis & Trading
YouTube: youtube.com/@TradewithRenatoUlianov
Disclaimer: All content is for educational and informational purposes only and does not constitute financial advice.
YouTube: youtube.com/@TradewithRenatoUlianov
Disclaimer: All content is for educational and informational purposes only and does not constitute financial advice.
免责声明
这些信息和出版物并非旨在提供,也不构成TradingView提供或认可的任何形式的财务、投资、交易或其他类型的建议或推荐。请阅读使用条款了解更多信息。