
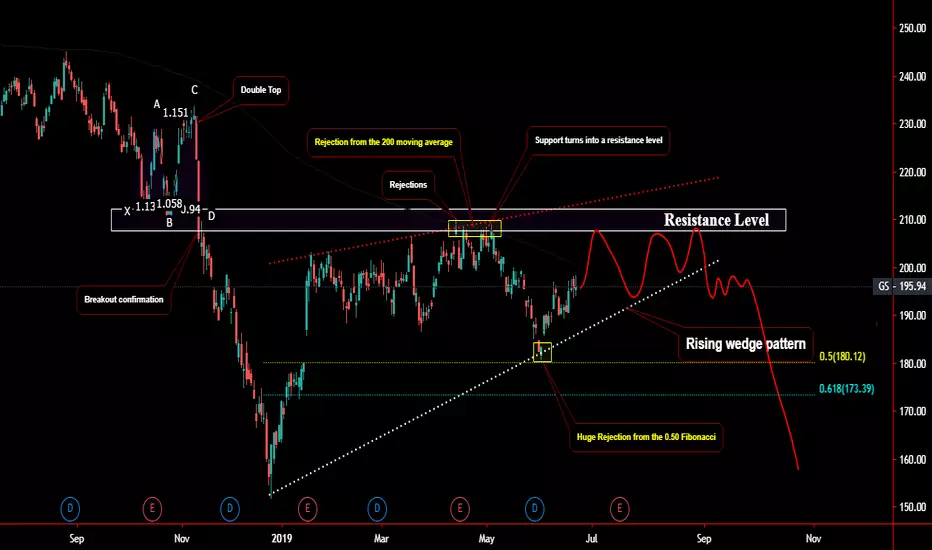
As we can see on the Daily chart the price keep moving to the downside we have a double top with a break confirmation causes a huge drop into 155.0, huge continuation to the upside into the previous low the price touched and reject each times to turns the previous support into a new resistance level with crossing the 200 MA then the price drop again and reject from the 0.50 fib level the price could push higher again into the resistance before drop again as a sign to short we are waiting a breakout confirmation of the lower low of the rising wedge patter

免责声明
这些信息和出版物并非旨在提供,也不构成TradingView提供或认可的任何形式的财务、投资、交易或其他类型的建议或推荐。请阅读使用条款了解更多信息。
免责声明
这些信息和出版物并非旨在提供,也不构成TradingView提供或认可的任何形式的财务、投资、交易或其他类型的建议或推荐。请阅读使用条款了解更多信息。