
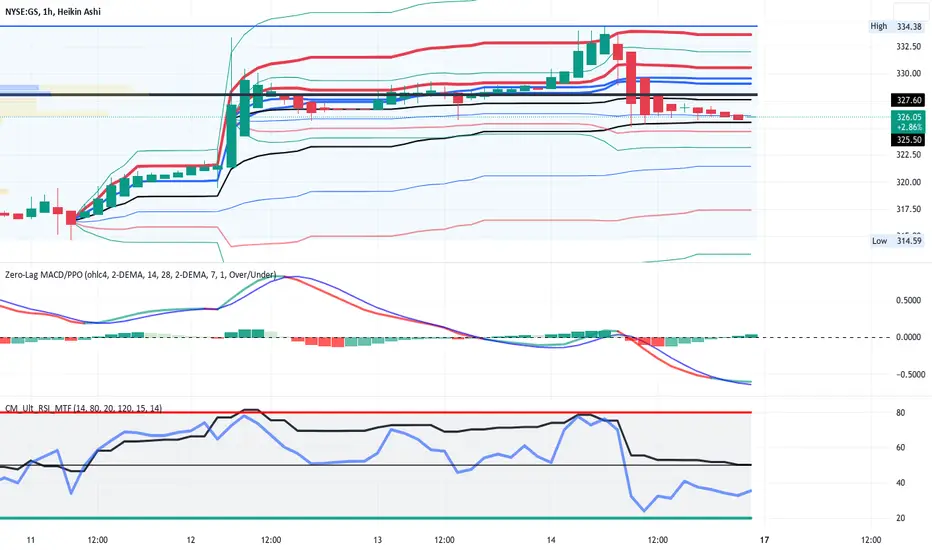
Goldman Sachs pivoted from a low on July 11th into a trend up until July 14th during
which it pulled back. Since earnings are on July 19th, I see room now for a pre-earnings
long entry. The MTF RSI indicator shows the lower TF RSI in blue reflecting the pullback
while the higher TF RSI in black shows the longer trend up with the RSI holding support at
50. The zero-lag MACD shows a line cross under a slightly positive histogram suggesting the
pullback will reverse to continuation. Overall, I see GS as being suitable for long entries
which I will take as call options. I will zoom into the 5 or 15 minute chart and look for a
pivot low as the ideal entry. I will set a stop loss of 10% while taking one contract as
a strike $330 expiring July 21st and another $330 expiring July 28th. I have picked targets
based on the upper standard deviations of the VWAP bands anchored back to the pivot
low on July 11th. Overall, I am expecting a 100% ROI on the two contracts.

免责声明
这些信息和出版物并非旨在提供,也不构成TradingView提供或认可的任何形式的财务、投资、交易或其他类型的建议或推荐。请阅读使用条款了解更多信息。
免责声明
这些信息和出版物并非旨在提供,也不构成TradingView提供或认可的任何形式的财务、投资、交易或其他类型的建议或推荐。请阅读使用条款了解更多信息。