
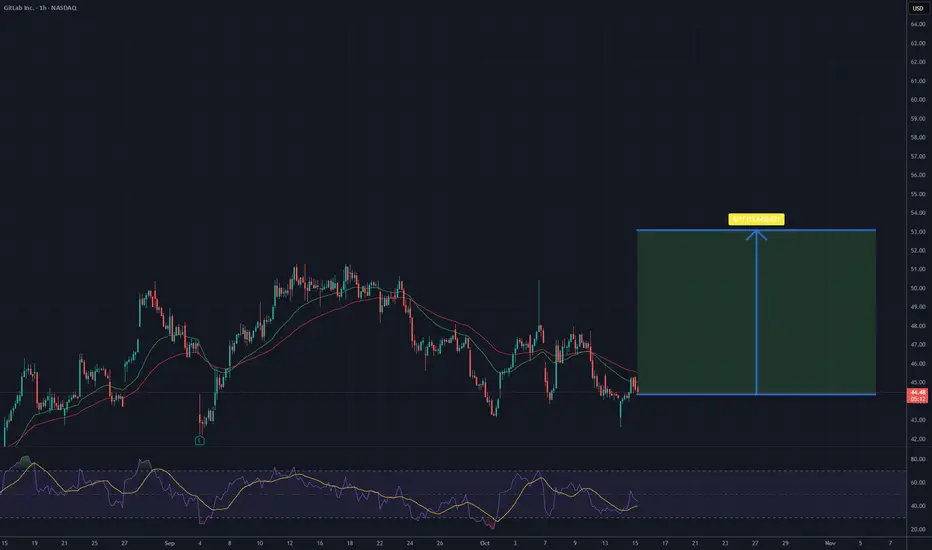
On the hourly chart of GitLab Inc. (NASDAQ: GTLB), there are signs of a potential rebound after a recent downtrend. The price is currently holding around the $44–$45 zone, which has acted as a strong support area from previous lows. Increased buying activity in this region suggests that a short-term upward move may be developing.
The moving averages are starting to flatten, and the shorter EMA (green) may soon cross above the longer EMA (red), which often signals an early trend reversal. Additionally, the RSI has bounced from oversold levels and is trending upward, indicating growing buying pressure.
If the price manages to stay above the $44 support level and break through the short-term resistance near $46, further gains toward the next resistance at $49 and ultimately toward $53 are likely — the latter being a key supply zone from previous highs.
In summary, technical indicators point to a possible short-term recovery, with momentum building for a potential price increase toward $53 in the coming sessions.
TP Potential - 53 USD
The moving averages are starting to flatten, and the shorter EMA (green) may soon cross above the longer EMA (red), which often signals an early trend reversal. Additionally, the RSI has bounced from oversold levels and is trending upward, indicating growing buying pressure.
If the price manages to stay above the $44 support level and break through the short-term resistance near $46, further gains toward the next resistance at $49 and ultimately toward $53 are likely — the latter being a key supply zone from previous highs.
In summary, technical indicators point to a possible short-term recovery, with momentum building for a potential price increase toward $53 in the coming sessions.
TP Potential - 53 USD
交易结束:到达目标
Target Done! 
免责声明
这些信息和出版物并非旨在提供,也不构成TradingView提供或认可的任何形式的财务、投资、交易或其他类型的建议或推荐。请阅读使用条款了解更多信息。
免责声明
这些信息和出版物并非旨在提供,也不构成TradingView提供或认可的任何形式的财务、投资、交易或其他类型的建议或推荐。请阅读使用条款了解更多信息。