GVT 3/5
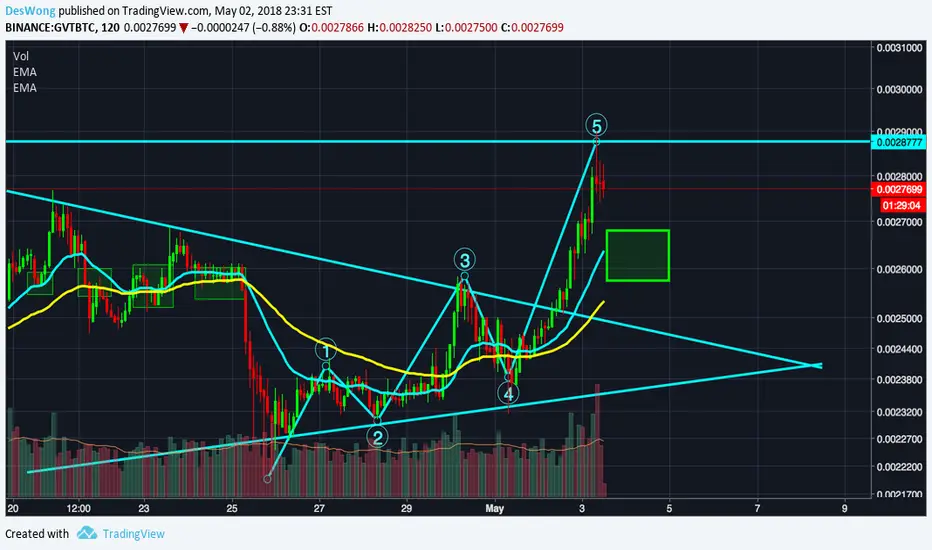
On a 2 hour chart, a hanging man has formed with its wick hit on the resistance and a doji with high volume have formed, RSI is overbought as well, it indicates the bull has lost its steam. So, a temporary correction is due.
The previous 25700 strong resistance has now become a strong support, expect a bounce from there.
Again, it is not financial advice and this chart is mainly for people who day-trade or swing-trade. For long term investor, you can ignore this short term price fluctuation.
The previous 25700 strong resistance has now become a strong support, expect a bounce from there.
Again, it is not financial advice and this chart is mainly for people who day-trade or swing-trade. For long term investor, you can ignore this short term price fluctuation.

免责声明
这些信息和出版物并非旨在提供,也不构成TradingView提供或认可的任何形式的财务、投资、交易或其他类型的建议或推荐。请阅读使用条款了解更多信息。