做空
GVTBTC Weekly Chart
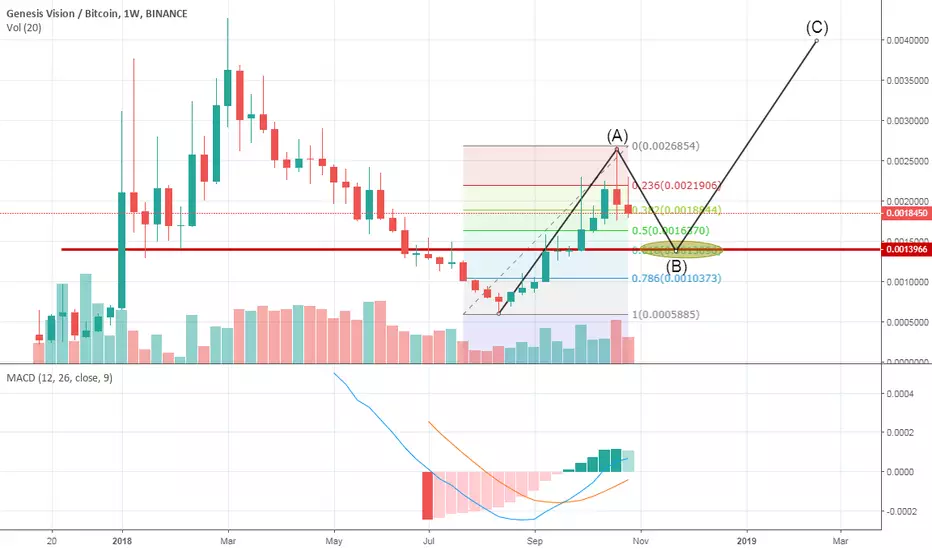
GVTBTC weekly chart looking bearish. it is looking in an ABC pattaern and now drawing B wave. it can go to fib 0.618 line and it is also strong support line (about 13900). fib 0.618 level (13900) can be a good buy point. Not a trade advice.
注释
Possible inverse Head and Shoulders Pattern

免责声明
这些信息和出版物并非旨在提供,也不构成TradingView提供或认可的任何形式的财务、投资、交易或其他类型的建议或推荐。请阅读使用条款了解更多信息。
免责声明
这些信息和出版物并非旨在提供,也不构成TradingView提供或认可的任何形式的财务、投资、交易或其他类型的建议或推荐。请阅读使用条款了解更多信息。