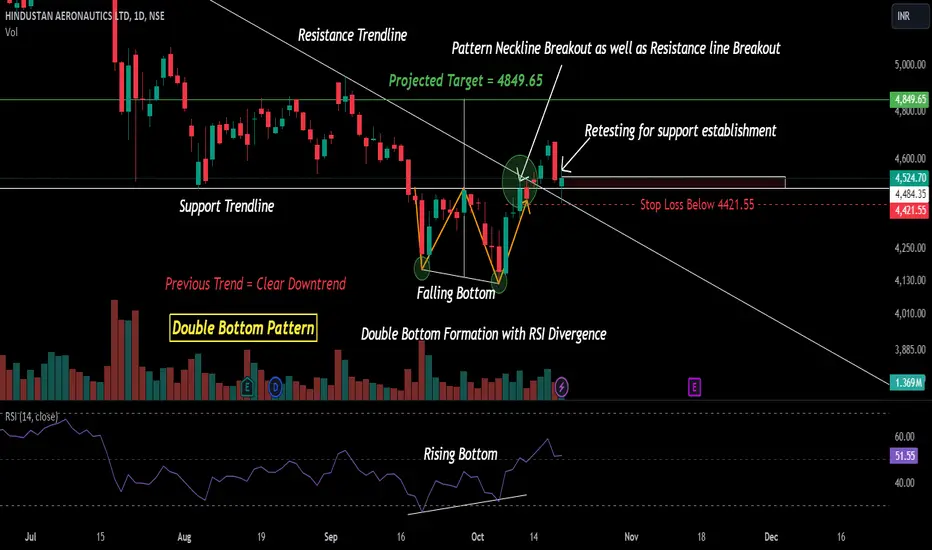
Double Bottom Pattern with an RSI Divergence in HAL on a Daily Timeframe!
Double Bottom Pattern Formation in HAL !
HAL !
Neckline Breakout in HAL!
Analysis:
HAL has made a Double bottom pattern on a daily timeframe after its downtrend so the trend is most likely to change. As we can see price made falling bottoms but RSI has made rising bottoms so there is a clear divergence as I have indicated in the chart. We also can see the optimum volume during the breakout and also the stock is retesting its new support.
Trade Setup:
Refer to the Analysis and make your own decisions as per your Risk to Reward Ratio
Disclaimer:
Consider my analysis for Educational Purposes only.
Before entering into any trade -
1) Educate Yourself
2) Do your research and analysis
3) Define your Risk to Reward ratio
4) Don't trade with full capital
Double Bottom Pattern Formation in
HAL !Neckline Breakout in HAL!
Analysis:
HAL has made a Double bottom pattern on a daily timeframe after its downtrend so the trend is most likely to change. As we can see price made falling bottoms but RSI has made rising bottoms so there is a clear divergence as I have indicated in the chart. We also can see the optimum volume during the breakout and also the stock is retesting its new support.
Trade Setup:
Refer to the Analysis and make your own decisions as per your Risk to Reward Ratio
Disclaimer:
Consider my analysis for Educational Purposes only.
Before entering into any trade -
1) Educate Yourself
2) Do your research and analysis
3) Define your Risk to Reward ratio
4) Don't trade with full capital
交易结束:到达止损
Pattern Failure!
相关出版物
免责声明
这些信息和出版物并非旨在提供,也不构成TradingView提供或认可的任何形式的财务、投资、交易或其他类型的建议或推荐。请阅读使用条款了解更多信息。