
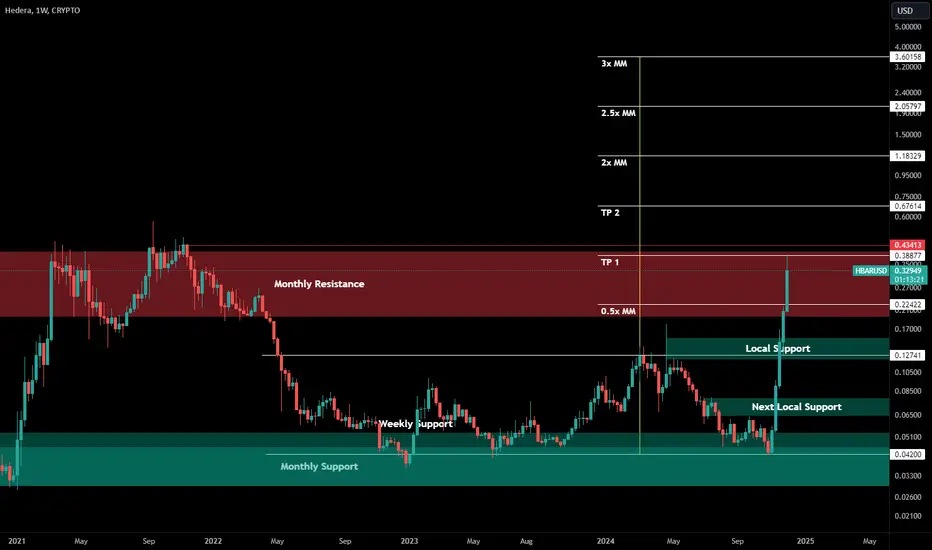
Publishing a monthly support and resistance chart, a weekly view of that chart - with targets - that I've been sharing for a while, so others can follow along.
This in addition to the parallel S/R chart that is already published here:

With an updated snapshot of it here (targets adjusted for where it broke out):

Possible areas of local support if any dips below monthly resistance are marked on the chart.
Hope this helps if you are following HBARUSD
This in addition to the parallel S/R chart that is already published here:
With an updated snapshot of it here (targets adjusted for where it broke out):
Possible areas of local support if any dips below monthly resistance are marked on the chart.
Hope this helps if you are following HBARUSD

免责声明
这些信息和出版物并非旨在提供,也不构成TradingView提供或认可的任何形式的财务、投资、交易或其他类型的建议或推荐。请阅读使用条款了解更多信息。
免责声明
这些信息和出版物并非旨在提供,也不构成TradingView提供或认可的任何形式的财务、投资、交易或其他类型的建议或推荐。请阅读使用条款了解更多信息。