
My previous analysis of this coin dates back 6 months.
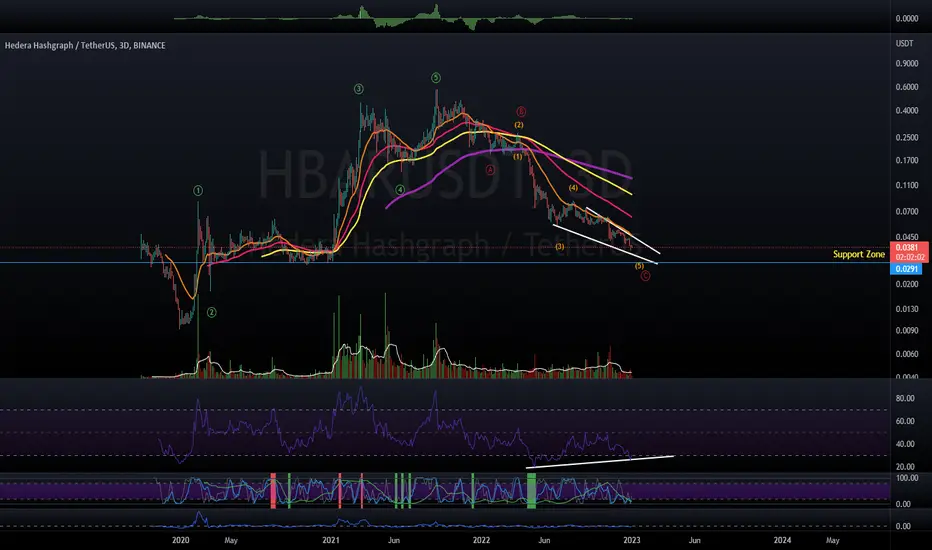
I got it wrong in that 70% odd should have been in favor of the correction not being done. In hindsight, there was no divergence on the weekly (there still isn't). But is that the relevant timeframe? Probably not, also in hindsight. Now, having zoomed in slightly to the 3D chart (still Log), we can see there is a nice divergence on many indicators (I've only marked RSI for clarity):
Is now the right time to say that we have 70% odds of the correction is over? I won't make that mistake again :D But its looking good. I'll be waiting with an alert set on my FSS Indicator to print a buy signal on this 3D timeframe to add to my bags.
Happy and safe trades to you all.
For reference, this is the link to the former Idea is below under related ideas.
I got it wrong in that 70% odd should have been in favor of the correction not being done. In hindsight, there was no divergence on the weekly (there still isn't). But is that the relevant timeframe? Probably not, also in hindsight. Now, having zoomed in slightly to the 3D chart (still Log), we can see there is a nice divergence on many indicators (I've only marked RSI for clarity):
- RSI
*MTF
*Histo
*Volume
*Rate of Change
Is now the right time to say that we have 70% odds of the correction is over? I won't make that mistake again :D But its looking good. I'll be waiting with an alert set on my FSS Indicator to print a buy signal on this 3D timeframe to add to my bags.
Happy and safe trades to you all.
For reference, this is the link to the former Idea is below under related ideas.

免责声明
这些信息和出版物并非旨在提供,也不构成TradingView提供或认可的任何形式的财务、投资、交易或其他类型的建议或推荐。请阅读使用条款了解更多信息。