
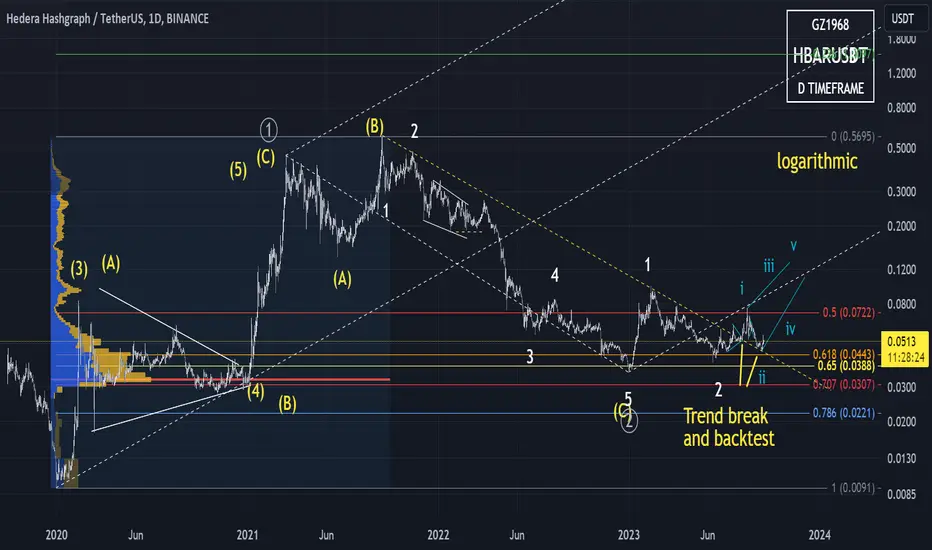
HBAR analysis
Multi-year trend line has been backtested.
12 EMA + Vegas chart indicator not showing buy yet (indicators lag)
Daily count shown. Notice trend line (log) has been broken and backtested.
8 hr count is tricky - I suspect HBAR is bullish and starting a diagonal. If I'm wrong, well then that sucks. 😆
1 hr count - in corrective mode right now. I show some ideas.
Multi-year trend line has been backtested.
12 EMA + Vegas chart indicator not showing buy yet (indicators lag)
Daily count shown. Notice trend line (log) has been broken and backtested.
8 hr count is tricky - I suspect HBAR is bullish and starting a diagonal. If I'm wrong, well then that sucks. 😆
1 hr count - in corrective mode right now. I show some ideas.
注释
Multi-year trend line shows a strong support and backtest completed注释
Remember, indicators lag. HBAR may be bullish already.注释
8 hr chart. The wave forms are corrective. This makes me thing either a diagonal is forming, or I'm wrong and some greater corrective structure is in play. I show the bullish diagonal scenario.注释
I show possible ideas on the 1 hr. So you can prepare to enter and make money.注释
If you wish to enter HBAR long here is a setup.注释
HBAR is presenting an excellent long entry. The golden zone (0.618 to 0.65 fibonacci) is the obvious entry point. There is a nice resistance line at the 0.65. It is possible that the 0.786 could be tagged. I show two possible channels.
免责声明
这些信息和出版物并非旨在提供,也不构成TradingView提供或认可的任何形式的财务、投资、交易或其他类型的建议或推荐。请阅读使用条款了解更多信息。