
📌 Current Price Context
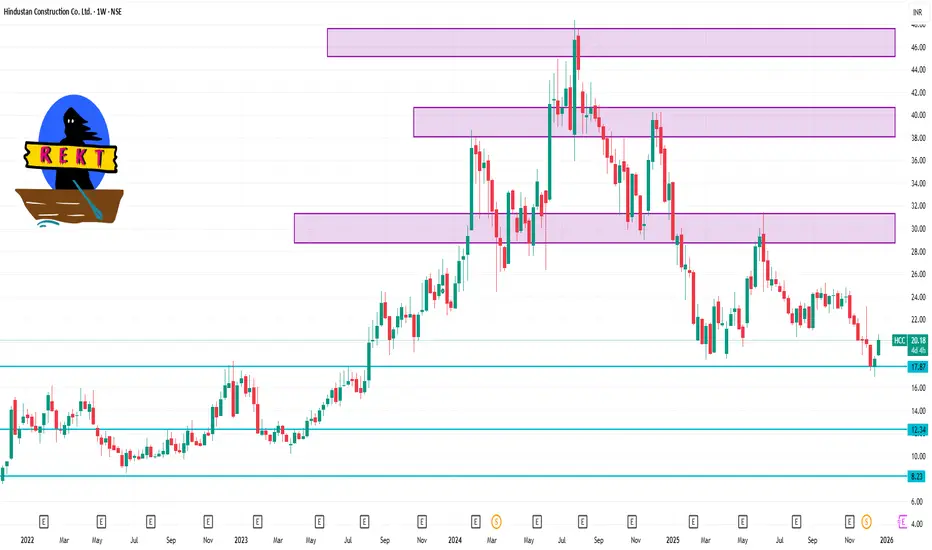
The stock has recently been trading around ₹18.5–₹20.1 (~Dec 19 close ~₹18.54) on NSE/BSE.
It has also shown strong short‑term momentum due to contract news and market interest.
📊 Weekly Levels (1‑Week Time Frame)
🟢 Resistance Levels – Where price may face selling pressure
These are potential upside barriers within the week:
R1: ~₹18.8–₹19.0 — First resistance band seen across pivot and short‑term technical data.
R2: ~₹19.0–₹19.4 — Stronger resistance from pivot clusters and 1‑week range highs.
R3: ~₹19.4+ — Next higher resistance level (weekly context).
👉 Bullish weekly break above ₹19.0–₹19.4 could open scope for further follow‑through.
🔵 Support Levels – Where price may find buying support
Areas where pullbacks may slow or reverse:
S1: ~₹18.15–₹18.20 — Immediate first support zone.
S2: ~₹17.75–₹17.80 — Next short‑term support (close to recent lows).
S3: ~₹17.50–₹17.55 — Key weekly base support range — a break below this could shift weekly structure.
📉 Weekly Pivot Reference
Weekly Pivot area: ~₹17.7–₹17.8 — often used as the short‑term balance zone.
The stock has recently been trading around ₹18.5–₹20.1 (~Dec 19 close ~₹18.54) on NSE/BSE.
It has also shown strong short‑term momentum due to contract news and market interest.
📊 Weekly Levels (1‑Week Time Frame)
🟢 Resistance Levels – Where price may face selling pressure
These are potential upside barriers within the week:
R1: ~₹18.8–₹19.0 — First resistance band seen across pivot and short‑term technical data.
R2: ~₹19.0–₹19.4 — Stronger resistance from pivot clusters and 1‑week range highs.
R3: ~₹19.4+ — Next higher resistance level (weekly context).
👉 Bullish weekly break above ₹19.0–₹19.4 could open scope for further follow‑through.
🔵 Support Levels – Where price may find buying support
Areas where pullbacks may slow or reverse:
S1: ~₹18.15–₹18.20 — Immediate first support zone.
S2: ~₹17.75–₹17.80 — Next short‑term support (close to recent lows).
S3: ~₹17.50–₹17.55 — Key weekly base support range — a break below this could shift weekly structure.
📉 Weekly Pivot Reference
Weekly Pivot area: ~₹17.7–₹17.8 — often used as the short‑term balance zone.

Contact Knowledgehub for a detailed consultation: Dm on WhatsApp: [wa.link/a2o0kz]-
Phone No: [+91 93102 26243]-
Email: [tradingviewknowledgehub@gmail.com]---
-- Let’s achieve success together!
Phone No: [+91 93102 26243]-
Email: [tradingviewknowledgehub@gmail.com]---
-- Let’s achieve success together!
相关出版物
免责声明
这些信息和出版物并非旨在提供,也不构成TradingView提供或认可的任何形式的财务、投资、交易或其他类型的建议或推荐。请阅读使用条款了解更多信息。
Contact Knowledgehub for a detailed consultation: Dm on WhatsApp: [wa.link/a2o0kz]-
Phone No: [+91 93102 26243]-
Email: [tradingviewknowledgehub@gmail.com]---
-- Let’s achieve success together!
Phone No: [+91 93102 26243]-
Email: [tradingviewknowledgehub@gmail.com]---
-- Let’s achieve success together!
相关出版物
免责声明
这些信息和出版物并非旨在提供,也不构成TradingView提供或认可的任何形式的财务、投资、交易或其他类型的建议或推荐。请阅读使用条款了解更多信息。