
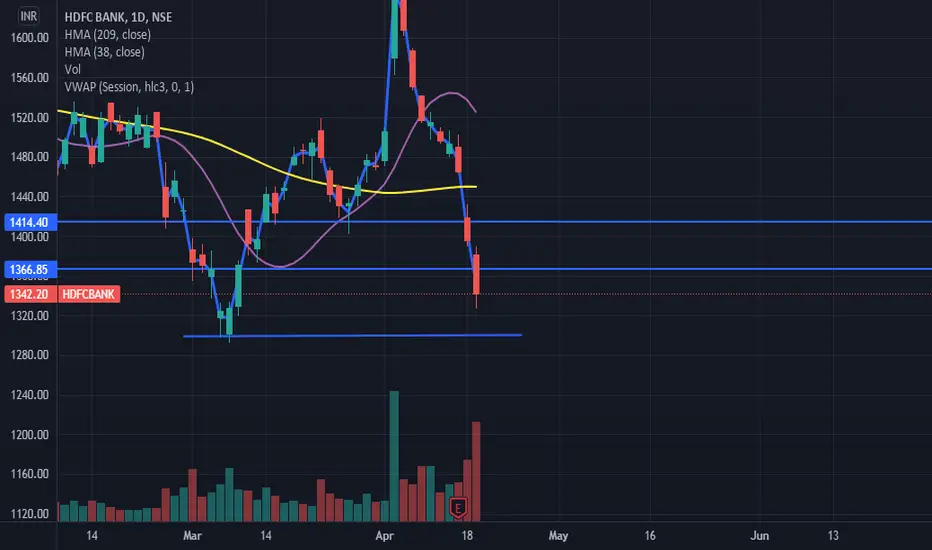
- on the daily chart : the day closed with a good red candle with slight resistance from the bottom . so daytraders who followd my advice and went short today congrats on ur profits .
- on the weekly chart : a biiig green candle that show a potentiel selling squeez .
- on the 15 min chart : the price broke the VWAP downards.
- personal opinion : sellers beware . the big candle formd in the weekly chart might mean a squeez and the big sellers are getting ready to take their profits . so a reverse in trend might happen soon
- best move :
for day traders : becarful from now on things might get unstable . so i suggest to not open any positions
for long term traders : wait untill the price reachs the bottom level
i hope this technical analysis helpd you make a decision , if you need help or want me to keep an eye on a stock/forex/crypto/futures.... and keep you updated feel free to contact me on my twitter or private chats in tradingveiw.

免责声明
这些信息和出版物并非旨在提供,也不构成TradingView提供或认可的任何形式的财务、投资、交易或其他类型的建议或推荐。请阅读使用条款了解更多信息。