做多
HEX 3D CHART- Is the Bottom In?
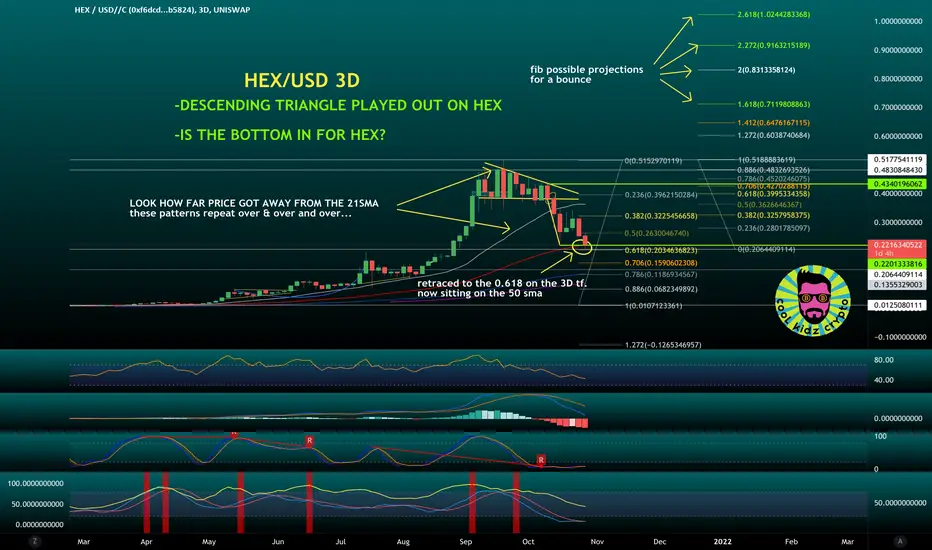
HEX 3D CHART W/ ANALYSIS
⚪️ANALYSIS
Descending triangle played out to a tee. Meas. Move to the 0.618. Investors like to play these golden pockets for area to pick up retracements. Fib possible projections are outined on the chart for a bounce if HEX break ATH.
SRSI Low
MACD Low
FIB Retracement to the 0.618
*Note about the bottom indicator.
Would like to see the YELLOW line (regular Stoch) dip to oversold region as well but not necessary. if all 3 indicators get to a “bundle” under the oversole area + it throws a MTF (multi time Frame) stoch buy (green buy signal) then on these higher time frames it can really be a great sign for reversal.
We are simply looking for as many points of colfluence as we can find. That what gives us an egde.
DISCLAIMER: NOT FINANCIAL ADVICE
FOR EDUCATIONAL PURPOSES ONLY

免责声明
这些信息和出版物并非旨在提供,也不构成TradingView提供或认可的任何形式的财务、投资、交易或其他类型的建议或推荐。请阅读使用条款了解更多信息。
免责声明
这些信息和出版物并非旨在提供,也不构成TradingView提供或认可的任何形式的财务、投资、交易或其他类型的建议或推荐。请阅读使用条款了解更多信息。