
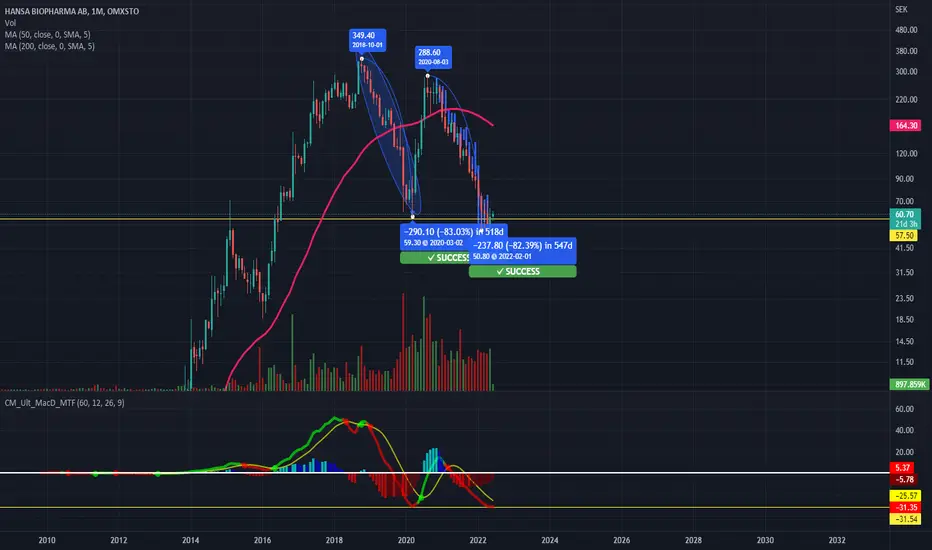
I don't know if this is a valid method but it caught my eye that the bars pattern of the last dowtrend and the downtrend before are very alike. Both with a downmove of around 83%. On the MACD it also moved up at the same level so could this mean something?
Could this be a valid theory or am I just trippin?
Not finncial advice in case this wasn't already clear :)
Could this be a valid theory or am I just trippin?
Not finncial advice in case this wasn't already clear :)

免责声明
这些信息和出版物并非旨在提供,也不构成TradingView提供或认可的任何形式的财务、投资、交易或其他类型的建议或推荐。请阅读使用条款了解更多信息。