做多
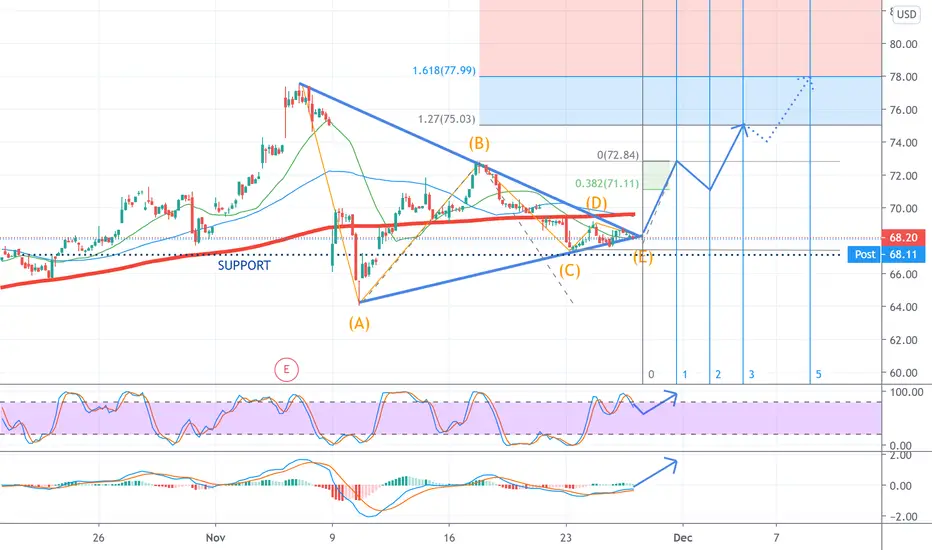
$HOLX Correction Pattern
 HOLX
Testing Correction Pattern theory: Bull Pennant with support. In theory this is ready to bounce – fib trend would suggest 1.27 is at $75.
“I’m not an expert but I have watched a lot of youtube videos.”
$NASDAQ:HOLX
注释
Breaking the 200SMA will be key. If it resists, I think the chart will fail.注释
Held the bottom trend line - higher lows, extended-tighter consolidation... I think that tends to mean a larger gap up. I switched to the EMA chart today instead of the SMA and it broke the 50 day EMA and road the top side of the 20 day... I think the Chart is still in play. Let's see how it goes!交易结束:到达目标
This may continue to go up more but taking some profit now.
免责声明
这些信息和出版物并非旨在提供,也不构成TradingView提供或认可的任何形式的财务、投资、交易或其他类型的建议或推荐。请阅读使用条款了解更多信息。
免责声明
这些信息和出版物并非旨在提供,也不构成TradingView提供或认可的任何形式的财务、投资、交易或其他类型的建议或推荐。请阅读使用条款了解更多信息。