
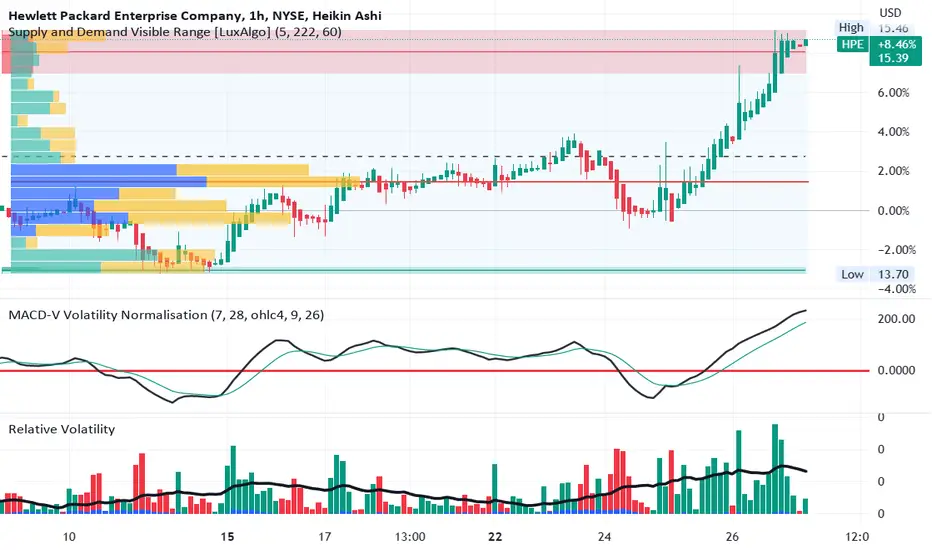
As shown on the one-hour chart, in the last trading session, HPE broke out of its usual trading
the range being the blue high-volume area on the profile. This is with increased volatility as
shown by the indicator and the large top wicks on the rising green candles. Why did this
occur? Were traders simply buying anything in the IT sector vaguely related to AI after the
NVDA breakout? Does HPE have a role in artificial intelligence? Was this a sympathy play?
The Luxalgo Supply / Demand indicator shows supply immediately overhead. The wicks on the
last several candles show a defined level. This might be called a " tweezer top " Overall,
I see this as an excellent short setup to be played with either short selling or a put option as the
retracement seems inevitable.
the range being the blue high-volume area on the profile. This is with increased volatility as
shown by the indicator and the large top wicks on the rising green candles. Why did this
occur? Were traders simply buying anything in the IT sector vaguely related to AI after the
NVDA breakout? Does HPE have a role in artificial intelligence? Was this a sympathy play?
The Luxalgo Supply / Demand indicator shows supply immediately overhead. The wicks on the
last several candles show a defined level. This might be called a " tweezer top " Overall,
I see this as an excellent short setup to be played with either short selling or a put option as the
retracement seems inevitable.
交易开始
trading is consolidated. Holding for retracement.交易结束:到达目标
HPE finally got the big drop. Call options closed at 35% ROI. Will now watch for thebounce up from the retracement down. Got enough to buy office heavy duty lazer printers for a dozen friends. Looking for more profit from the volatility. Will go
long when the zag starts zigging.
交易开始
HPE rebounded long position re-entered 交易开始
HPE is in a rising channel and appears ready for an entry at the lower supporttrendline.
注释
target 19- both shares anc call options taken.
免责声明
这些信息和出版物并非旨在提供,也不构成TradingView提供或认可的任何形式的财务、投资、交易或其他类型的建议或推荐。请阅读使用条款了解更多信息。
免责声明
这些信息和出版物并非旨在提供,也不构成TradingView提供或认可的任何形式的财务、投资、交易或其他类型的建议或推荐。请阅读使用条款了解更多信息。