
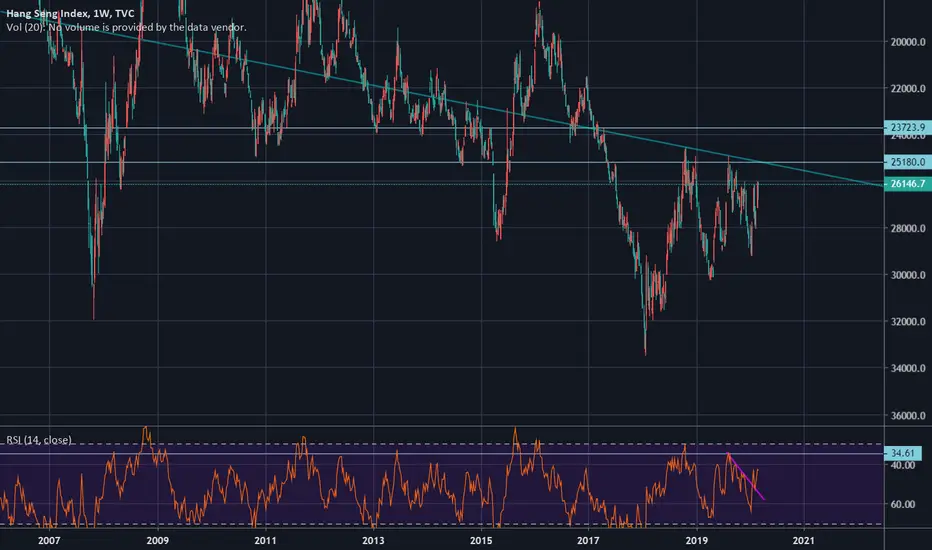
While everyone is trying catch a bottom, the HSI Inverted Weekly Chart gives a bearish view on the Hang Seng Index.
The candles from the last three weeks are bearish:
1) A Reversal Red Candle
2) A Gap with Solid Long Red Candle
3) Green Candle with Long Wick
In the coming two weeks it may hit and test the weekly support line at around 25180.
Let's see how the market reacts to the support level.
If selling is strong, it may break below 24000.

免责声明
这些信息和出版物并非旨在提供,也不构成TradingView提供或认可的任何形式的财务、投资、交易或其他类型的建议或推荐。请阅读使用条款了解更多信息。