
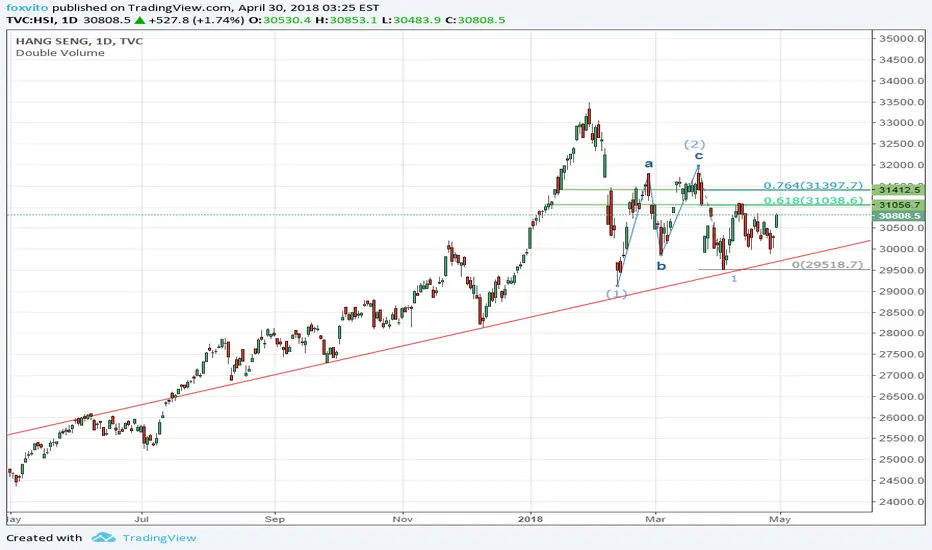
As stated in the diagram. HSI might go downward as the fibonacci ratio match. The target of the wave may be 26000.
If we see any strong resistance at 31000 or 31400 in this week. It is very likely that HSI will follow this trend to move
If we see any strong resistance at 31000 or 31400 in this week. It is very likely that HSI will follow this trend to move
交易手动结束
Unfortunately, HSI cannot stand on 0.764 (around 31400). See it immediately drop under it the next day.As now the RSI is very low and comes to a critical support line. I close the position first. Wait and see if it is a rebound or a new raising wave.
交易结束:到达止损

免责声明
这些信息和出版物并非旨在提供,也不构成TradingView提供或认可的任何形式的财务、投资、交易或其他类型的建议或推荐。请阅读使用条款了解更多信息。