 HSI
HSI  HK50
HK50 Hello everyone!
🔥 Fire continues burning Hang Seng.
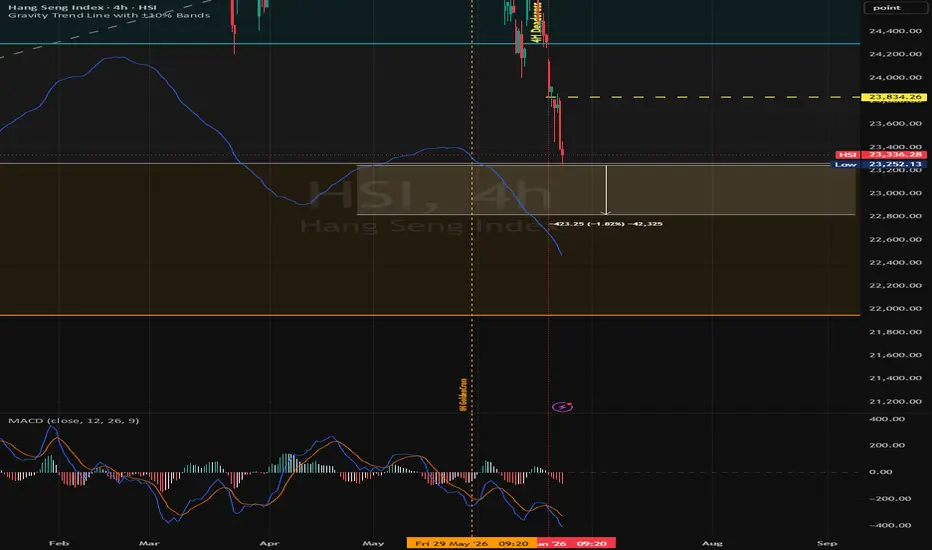
HSI hitting turkey streak again which is a norm for its character, and it fells to one year low.
HSI continue its selling feast.
Don't think should catch this falling knife is sharp!
From D chart, 4H & 1H it broke the market structure and seller is in control.
MACD had been moving within the bearish zone (i.e below zero level) since 27/28 May 2026).
Also traded below MA200 thereafter.
VHSI surged to 23.52 ; >5% today, signaling modest panic sell.
Price is moving towards the lower band -10% of Gravity Trend Line GTL i.e 22,790
For W chart its GTL lower band is at 22850
Hence, this might be the key support level to watch.
Monitor for its rebound for those who are still holding bearish position.
For longer term - W chart
MACD & Signal break below zero level end week of 15Jun2026. This may kickstart its bear trend!
Not sure if it's coincidence, the previous W chart MACD broke down zero level was on the week of 5Jun2023; and it reversed after 8 months- 10 months.
Hence, if the cycle repeat, HSI gonna continue to extend its loss for another 20% likely to 22,117 level; i.e M chart GTL.
Resistance :
R3: 25000 - key resistance level
R2 :23800 -23830
R1 :23430-23500 (immediate)
Today closed : 23,336
Support :
S1: 23185-23000 psychological support level if this break it's gonna continue its fear selling panic.
S3: 22800-22500
Manage your risk.
Happy trading everyone!

免责声明
这些信息和出版物并非旨在提供,也不构成TradingView提供或认可的任何形式的财务、投资、交易或其他类型的建议或推荐。请阅读使用条款了解更多信息。