
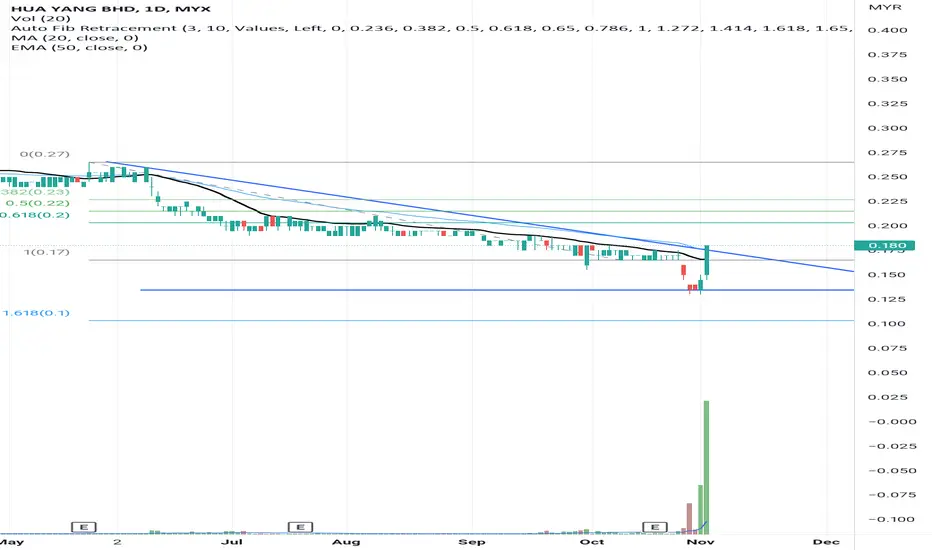
The candlestick indicates a price breakout above the " triangle" pattern neckline on 2 Oct 2022 backend with volumes. Thus, closed above the SMA line where the stock has consolidated and formed a "return move".
The MACD indicates a divergent pattern where confirming the initial significant price movement toward the next price resistance.
The RSI indicates a bullish reading backed by a positive signals in the trend.
Let's save HUAYANG in WL and watch out significant price movement toward the next price resistant backed by volumes.
R 0.195
S 0.160

免责声明
这些信息和出版物并非旨在提供,也不构成TradingView提供或认可的任何形式的财务、投资、交易或其他类型的建议或推荐。请阅读使用条款了解更多信息。
免责声明
这些信息和出版物并非旨在提供,也不构成TradingView提供或认可的任何形式的财务、投资、交易或其他类型的建议或推荐。请阅读使用条款了解更多信息。