
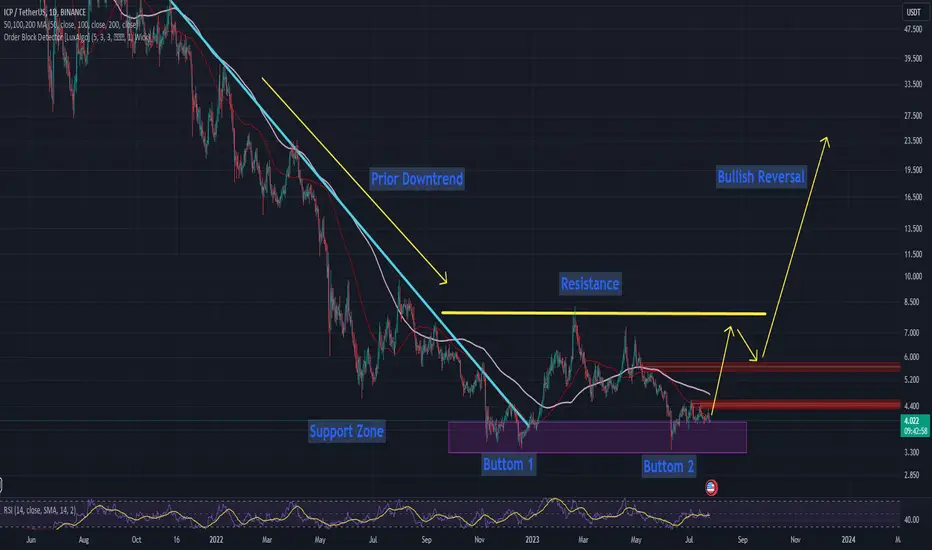
A double bottom pattern is a classical pattern that indicates a change in trend and a shift in momentum from bearish to bullish. It is composed of two consecutive troughs that bottom out at roughly the same price level. This level acts as a support for the price. The double bottom formation is a bullish reversal pattern that is created after a prolonged downtrend. In order to identify this pattern, you will need to look for the following:
1. Two distinct troughs that bottom out at roughly the same price level.
2. A moderate rally in between the two troughs, creating a resistance.
3. A break above the resistance after the 2nd trough is formed.
If you see a chart with these characteristics, you have recognized a double bottom pattern.
This pattern is regarded as a very reliable reversal signal, and traders frequently use it to enter long positions.
1. Two distinct troughs that bottom out at roughly the same price level.
2. A moderate rally in between the two troughs, creating a resistance.
3. A break above the resistance after the 2nd trough is formed.
If you see a chart with these characteristics, you have recognized a double bottom pattern.
This pattern is regarded as a very reliable reversal signal, and traders frequently use it to enter long positions.
注释
Liquidation MapShort 🩸 🩸🩸 3 M ⚠️ -> $4.48
Longs ✅✅ ✅ 300 k -> $3.6
注释
Liquidation MapShort 🩸 🩸🩸 5.32 M ⚠️⚠️⚠️ -> $ 4.5
Longs ✅✅ ✅ 100 k -> $3.12
交易开始
The upward price explosion liquidating the shorts can be monstrous.交易开始
The idea is still valid. ✅✅✅It is a long-term position 💎💎💎
交易开始
First resistance 4.5 -> BROKEN ✅Second resistance 5.7 -> In progress 💎
交易开始
First resistance 4.5 -> BROKEN ✅Second resistance 5.7 -> BROKEN ✅
交易开始
Thanks to everyone who supported me, enjoy the profits. This is for the long term!
免责声明
这些信息和出版物并非旨在提供,也不构成TradingView提供或认可的任何形式的财务、投资、交易或其他类型的建议或推荐。请阅读使用条款了解更多信息。
免责声明
这些信息和出版物并非旨在提供,也不构成TradingView提供或认可的任何形式的财务、投资、交易或其他类型的建议或推荐。请阅读使用条款了解更多信息。